Heat maps are a great way of seeing what areas of your site visitors are clicking. This information can be used to address problems on your site or improve certain areas. The most well known service that provides this is CrazyEgg. They provide a fantastic service however a website with only 800 visits per day will cost you $19 per month.
Therefore I was excited to see that a free solution is available to WordPress users. HotSpots is a plugin that shows an overlay over your website to show where visitors are clicking.
After installing, the first thing you need to do is ensure that ‘Enable drawing hotspots’ is checked. The plugin still tracks data if this is unchecked but you won’t be able to see clicks visually. Which is kind of the whole point of the plugin therefore I’m not sure why this is disabled by default.
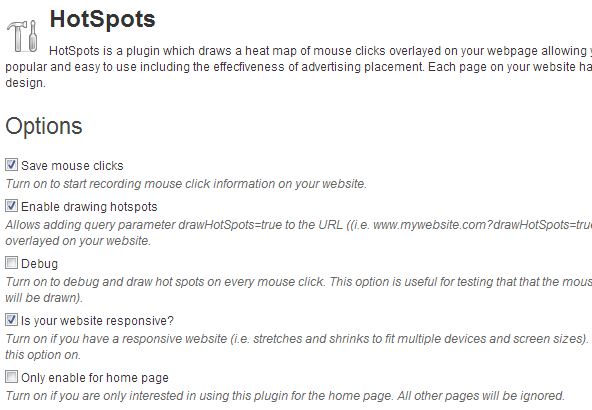
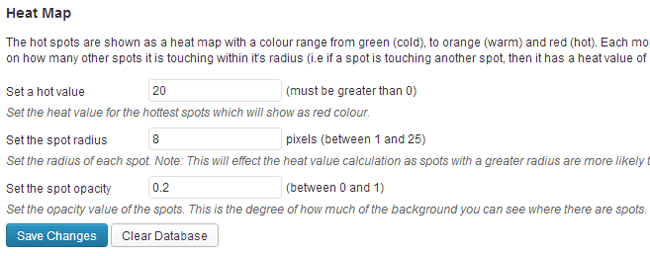
HotSpots shows clicks as green (cold), orange (warm) and red (hot). You can control how many clicks are necessary to be hot and the the size and opacity of hotspots too.
I’ve only been using it a few days so I don’t have a lot of data just now. Once I have collected more data, I will be able to see where visitors are clicking. Whilst Google Analytics will show you what page a visitor went to, HotSpots shows you what link they clicked to get there.
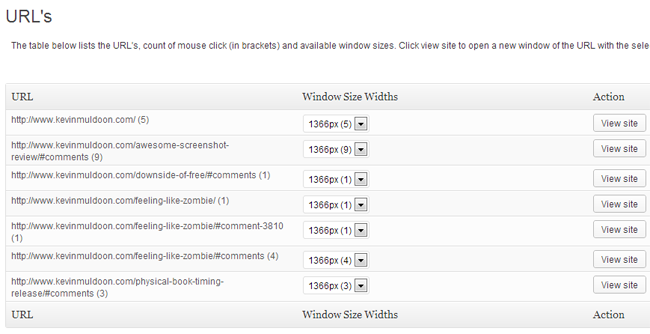
Clicking on the ‘view site’ button allows you to see a visual heat map of all the clicks.

HotSpots seems like a great free alternative to CrazyEgg. I’m sure the information will be very useful to me over time. I recommend trying it out for a few weeks and then reviewing the results.
Thanks,
Kevin
Link: HotSpots