Visme is a fantastic service that helps you create professional looking infographics and presentations. To date, over 410,000 graphical items have been created through their service since their initial launch in the middle of 2013.
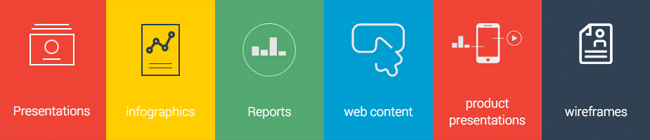
High quality content, such as infographics, presentations, and reports, have been used to much success over the last few years by search engine optimisation companies and high profile bloggers.
They are fantastic link bait items. A well produced graphical piece of content could generate tens of thousands of incoming links. It is therefore no surprise that marketers use this type of content to promote their clients’ websites.
After eight months of development, Visme have completed their most significant update to their service. The new interface provides a refined experience that gives anyone the tools to create amazing graphical content. You do not need to have coding or design experience in order to create content like a professional.
Let’s take a closer look at the service and see how easy the Visme service is to use.
Creating Beautiful Content in Minutes
The idea behind infographics, presentations, and other forms of high quality content, is to make boring and complex pieces of information easier to process. By displaying information in a more visual manner, you can explain complicated processes much easier than you could using plain text.
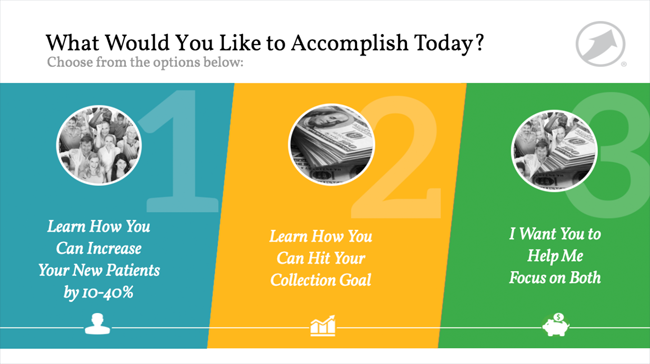
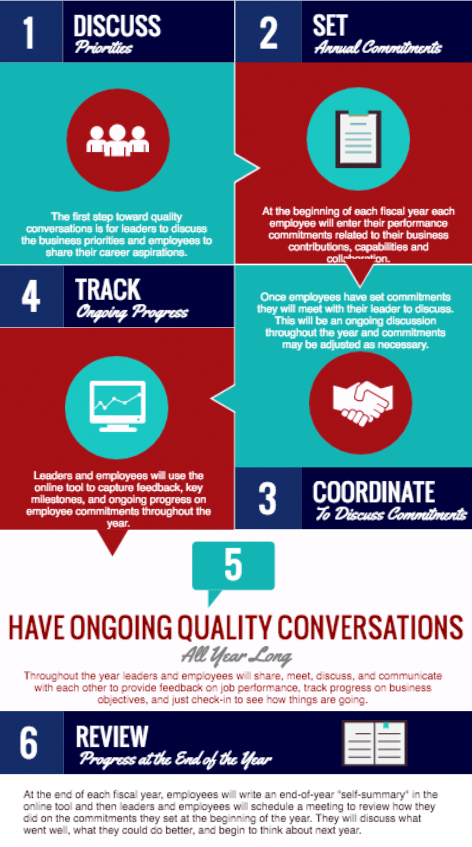
You can see examples of content created using Visme on their website. The example below shows you an infographic that was created by a Visme user.
The Visme dashboard displays a list of the projects you have created so far. All projects can be organised into folders.
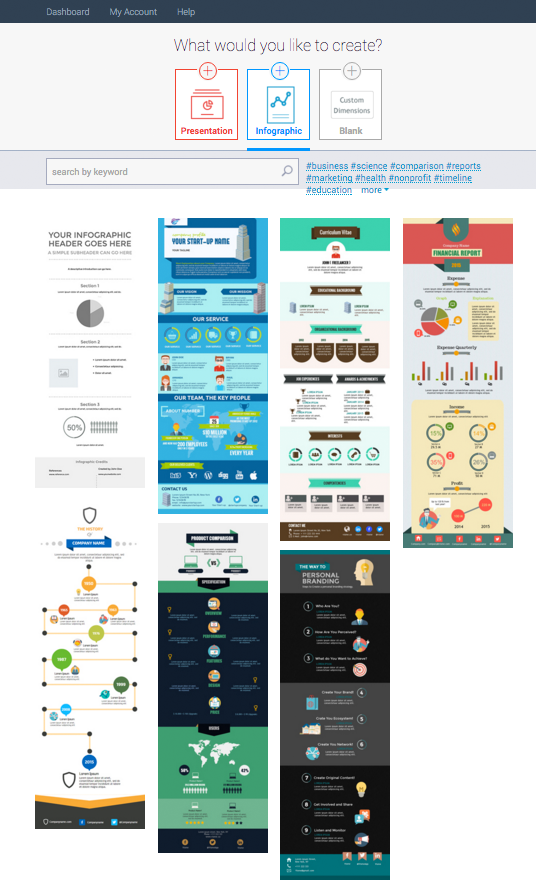
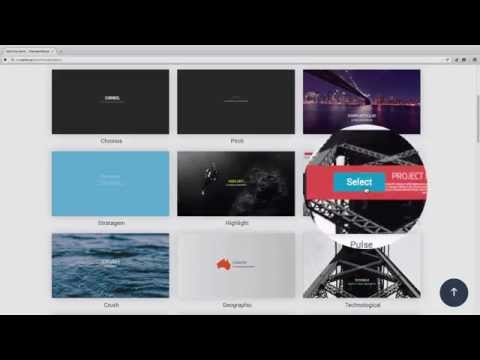
When you first launch the dashboard there is an option to import a PowerPoint presentation as an image or as an editable project. Alternatively, you can create a new project from scratch.
You will then be asked whether you want to create a presentation, an infographic, or whether you want to start with a blank canvas. You can define your own dimensions for your canvas if you you do not want to use one of the templates available for presentations and infographics.
It should only take you a minute to familiarise yourself with the Visme interface.
In the centre of the page is your project and all slides are displayed down the right-hand side of the page.
The left-hand side of the page is where are the design elements are.
The blue vertical box has eight different sections: Backgrounds, text, shapes and icons and graphics, images, charts and graphs and widgets, video, audio, and iframes.
You soon start to realise how much graphical content Visme provides to you. There are literally millions of text, images, vectors, and other graphical assets. All you have to do is drag and drop one of the assets into the canvas area.
There is over one hundred fonts available, an audio engine for recording your own music, and an animation engine that helps you create professional slides and presentations.
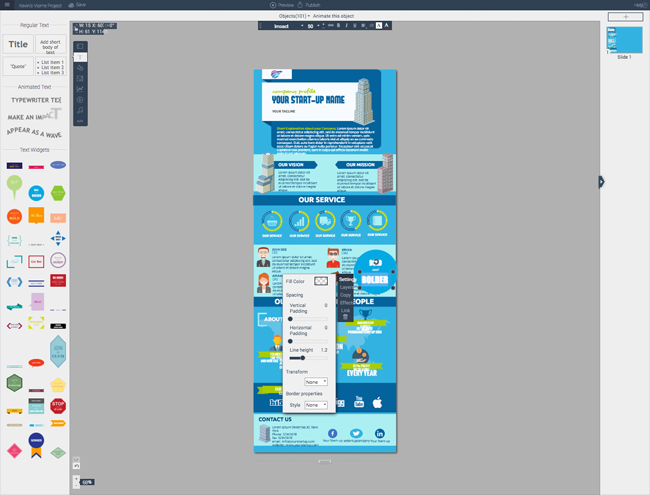
Creating and modifying projects is a breeze. Clicking on any element on your canvas will load up a box to modify. You can easily modify text, colours, and design elements such as padding, margins, and borders. You will also find controls to copy elements.
You can preview your project at any time to see how the full version of your project will look.
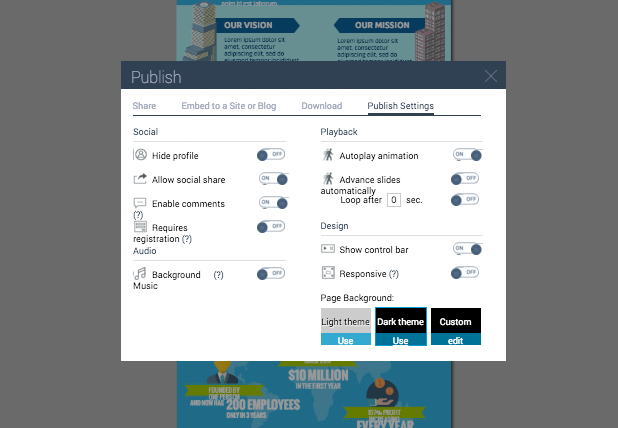
Once you are happy with the project, you can click publish.
A box will appear that allows you to share the project, embed the project on a site in responsive or fixed width mode, or download the project in JPG, PNG, PDF, or HTML5 format (certain plans restrict the downloadable formats available).
The publish box also has settings for social media, animation playback, and design.
You can return to your projects at any time and modify them from your Visme dashboard.
I was really impressed with how simple the whole process was. You should feel comfortable creating fantastic content with the Visme interface in a short space of time.
Pricing
A limited version of Visme is available free of charge. It allows three projects, 100MB of storage, and a limited number of charts and infograph widgets. Projects can only be downloaded in JPG format under this free plan.
Two premium plans are available: Standard and complete.
If you pay annually, the standard plan costs an effective rate of $7 per month and the complete plan costs $16 per month. If you choose to pay on a monthly basis, the standard plan costs $12 per month and the complete plan costs $28 per month.
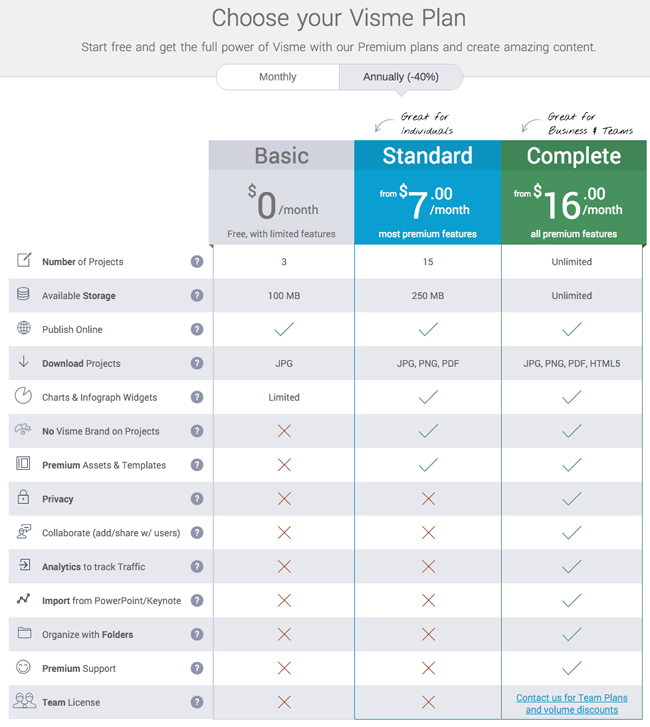
The standard plan increases projects to fifteen, storage to 250MB, and allows all charts and infograph widgets to be used. It also adds the ability to remove Visme branding, premium assets and templates, and the ability to save projects in JPG, PNG, and PDF formats.
The complete plan has no limitations. It allows an unlimited amount of projects and storage and you can save projects as JPG, PNG, PDF, and HTML5 files.
Additional features in the complete plan includes privacy, collaboration, analytics, PowerPoint and Keynote importing, folder organisation, premium support, and team licenses.
Educational institutions and registered non-profit organisations receive a discount on their purchases.
Final Thoughts
I was incredibly impressed with Visme. It boasts a user-friendly interface and offers millions of graphics and other assets for creating infographics, presentations, and more.
When you consider that many design companies charge thousands of dollars for creating an infographic, being able to create your own for a relatively small fee will save you a huge amount of money.
The free plan from Visme does not offer all features, but it is still a capable tool for creating graphical presentations and reports. At the very least, it is a great way of trying Visme for yourself and seeing what the service can do.
I encourage you to drop by Visme and check out their service for yourself. I have only touched upon the main features of Visme so I recommend trying them out yourself to see for yourself what it can help you create. You won’t be disappointed.
Thanks for reading.
Kevin