
CreoWorx are a WordPress development company that have released a couple of good plugins through CodeCanyon.
They are known for their popular WordPress plugin Easy Social Share Buttons. You can see these sharing buttons in action at the bottom of this post and read more about the plugin in the review I published last month.
CreoWorx includes another plugin with Easy Social Share Buttons entitled Easy Social Metrics Lite. Easy Social Metrics will show you information about how your content is being shared on popular social media networks.
As you would expect, the lite version of the plugin is fairly limited and is merely included to promote the plugin. When the developers offered me an opportunity to test Easy Social Metrics Pro, I jumped at the chance. I had been using the free plugin Social Metrics for many years to track social sharing activity. As that plugin has not been updated since the beginning of 2013, I was keen to try a social tracking solution that was up to date.
I have been using Easy Social Metrics Pro over the last few weeks and have a good understanding of what it can do. In this article, I would like to walk you through what the plugin offers and show you how it can help you with your website.
What Does Easy Social Metrics Pro Offer?non-en
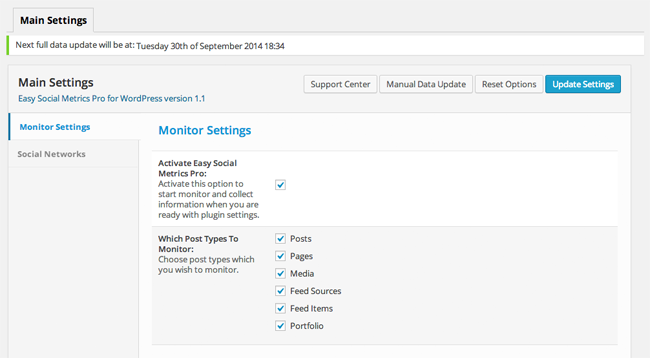
Most social metric WordPress plugins only monitor blog posts or blog posts and pages. Easy Social Metrics Pro appears to be one of the only solutions available at the moment that supports all custom post types.
In the main settings area of the plugin you can disable any post type that you do not want to track.
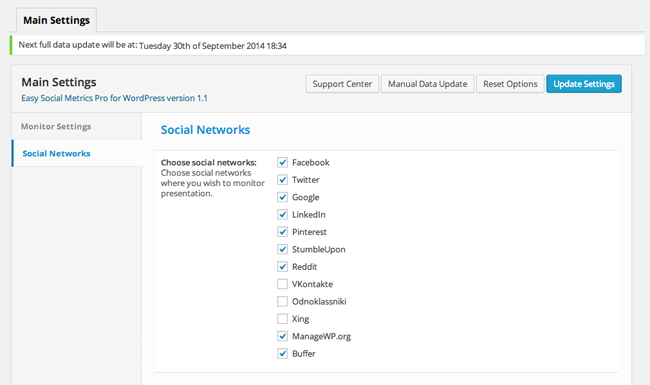
The plugin can track shares of your pages across 12 social media networks: Facebook, Google+, Twitter, LinkedIn, StumbleUpon, Pinterest, Reddit, Vkontakte, Odnoklassniki, ManageWP.org, Xing, and Buffer.
The non-English networks, VKontakte, Odnoklassniki, and Xing, are disabled by default. You can enable these through the social networks settings page.
What all of the above settings mean is that Easy Social Metrics Pro can be used to track any page of your website across 12 different social media networks. This information is useful for many reasons. For example, you can adapt your social media sharing buttons so that you focus on the social media networks that your content is being shared on.
The plugin also helps you see what articles are being shared on social media and what articles are not. This should help you plan out future posts.
The Social Metrics Dashboard
The main dashboard of Easy Social Metrics Pro is split into four areas: Overview, Detailed Period Report, Content Report, and Detailed Content Report.
Each area provides a couple of unique reports. With most reports, the date range can be changed to show data from a particular time period.
Let’s take a closer look at each section in detail.
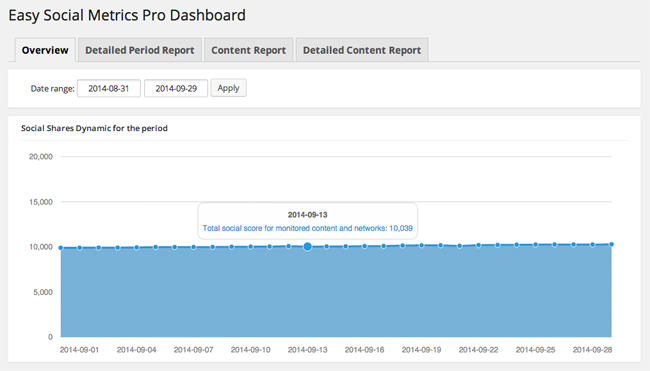
Overview Report
The overview section gives you a summary of how your website is performing in social media. The first report displays the total number of social shares of your content within a given time period (it defaults to one month).
Essentially, it is a way of seeing how your social media presence is growing; however it is not something I really give much attention as the total score is meaningless to me. On 31 August 2014 my social score was 9,899 shares and on 29 September 2014 it was 10,289 shares.
Therefore, I had 390 shares during that time period, which is an average of 13 shares per day. Yet neither of these stats are displayed in this report. You only get to see the total social media shares and I personally don’t find that useful.
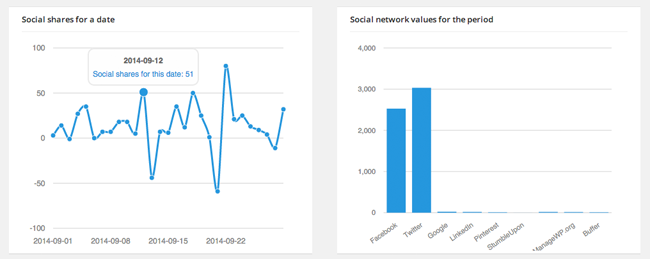
The social shares per date report is better. It allows you to hover over a particular day and see the total number of social media shares that day.
What continues to baffle me about this report is that there are some days with negative values. For example, on 13 September I had negative 44 shares and on 21 September I had negative 59. I have no idea what this means.
The social network values report highlights the total number of shares within a given period. There seems to be a bug with this as the total number of shares are being displayed, not just the shares within the time period I specified. This means that the Facebook and Twitter graphs are unnecessarily high.
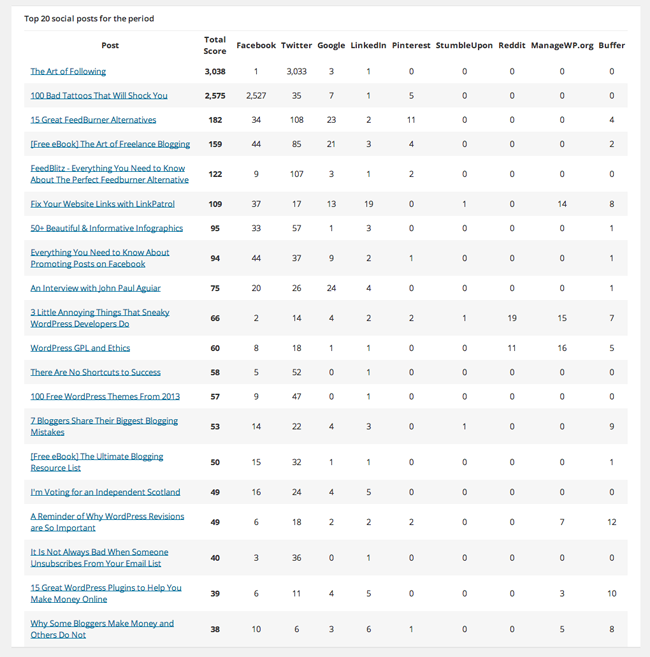
The same problem exists with the “Top 20 social posts for the period” report. Despite specifying a period between 31 August and 30 September; the report shows the total social media shares since my website was launched.
The top 20 posts is a great report as it lets you easily see which pages on your website are being shared.
Detailed Period Report
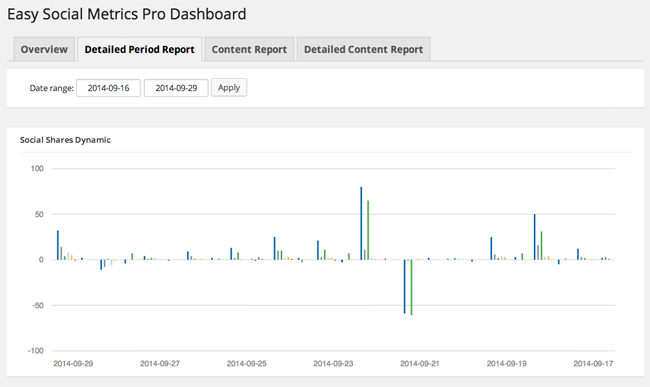
The Social Shares Dynamic report allows you to see how content is being shared within a specified time period.
Once again, in my report I saw some negative values here. I could understand a negative value being applied in some instances. For example, someone could delete their Twitter account and the retweet would therefore be removed, or perhaps someone on Facebook decided to unlike a post they liked.
However, I do not believe that is what is occurring here, as on 21 September the report shows that I received negative 61 shares on Twitter. Which leads me to think that there is a problem with the way the plugin is recording shares.
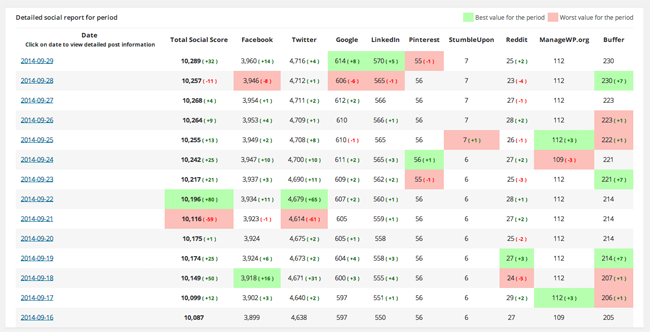
Underneath the Social Shares Dynamic report is a detailed report on how content was shared over a specified time period. The table uses green to highlight the best value for the period and red to highlight the worst.
You would expect the last day of the time period to have the highest number of shares. As you can see from my table below, that is not the case.
Content Report
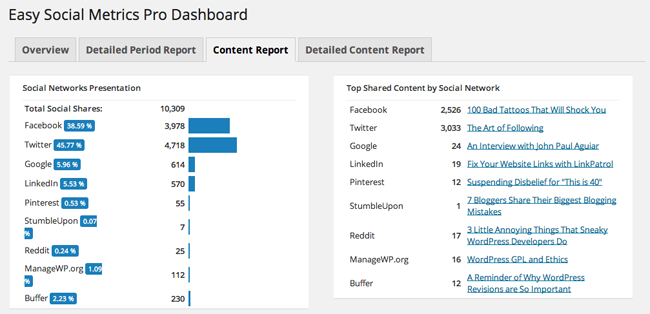
The content reports provide a lot of useful information. The Social Networks Presentation report shows the total number of shares the the distribution of those shares between different social media networks.
The other report is Top Shared Content by Social Network. It highlights the most shared page on your website for each network. This is an interesting report as it helps you see what types of articles are being shared on particular networks.
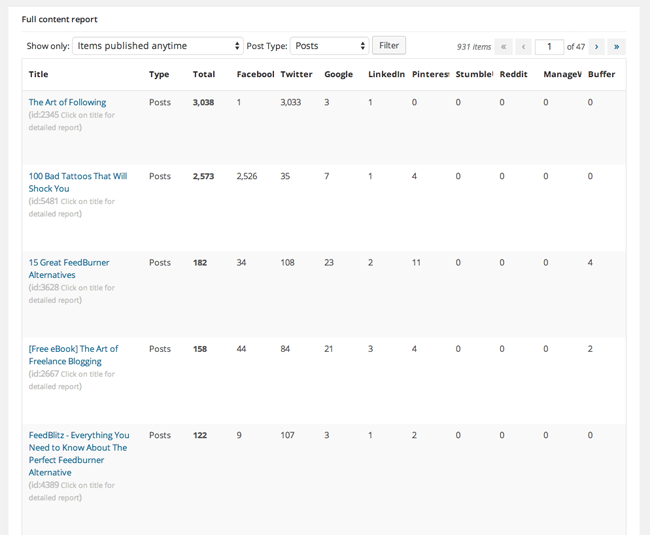
The full content report allows you to see a breakdown of how content is being shared. It can be filtered by any type of post type (posts, pages, media, etc). You can also show items from anytime or from the last month, last 3 months, last 6 months, or last 12 months. The list order can also be changed by simply clicking on the appropriate column header.
Detailed Content Report
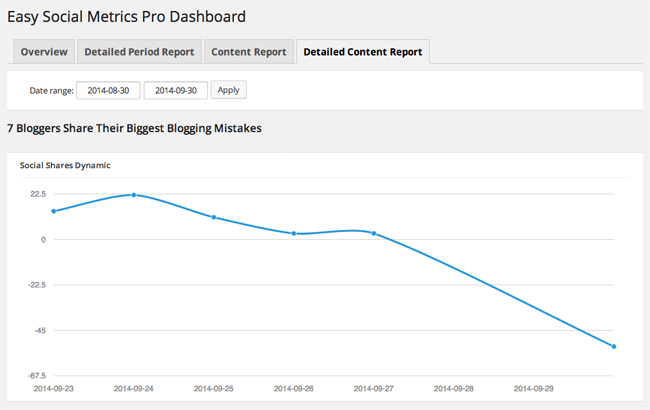
Clicking on of the items listed in the content report will take you to a detailed content report for that page (whatever custom post type that may be).
The first report shows you how shares of the page have changed over time. If a page has gone viral, this graph will show you how the page has been shared over time.
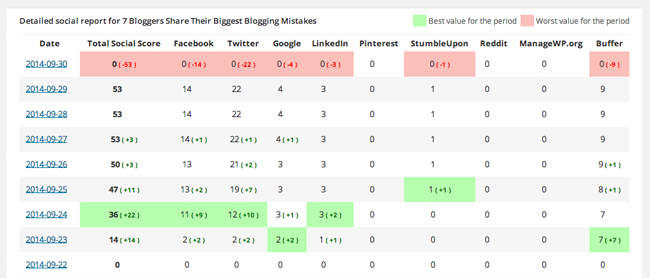
A detailed social report is displayed underneath. The best and worst days are highlighted in this table.
Final Thoughts
You may be wondering whether Easy Social Metrics Pro is the perfect way to monitor your social media activity online. No, it is not the perfect solution, but no such solution exists. All of the current solutions for tracking social media performance have their pros and cons.
Easy Social Metrics Pro is a great plugin, but I believe the plugin could be improved in a number of ways. The most important feature would be an option for users to customise reports themselves. Some reports will be beneficial to one person, but not another. So why not let users hide the reports they do not want and let them display the reports they do want.
I would also welcome:
- Individual reports for each social media network
- Details of the number of comments on specific blog posts
- An option to export data to a CSV file
The initial version I reviewed was sent to me on 2 September, however the developers kindly sent me the latest version, which had been released today. Unfortunately, some of the small bugs I found still exist. Specifically, the issue with some reports showing stats for all time instead of a specific time period, and the issue with negative values in some reports.
Easy Social Metrics Pro is available from CodeCanyon for $28. The developers appear to be actively updating the plugin and responding to queries from customers.
If you are looking for a free alternative, check out Social Metrics, WP Social Stats, Social Metrics Tracker, and Social Stats Panel. These plugins do not support as many social media networks and do not support custom post types; however they may be sufficient for you if you just want a general overview of your social media performance.
Those of you who do want to track social media performance of custom post types should definitely consider Easy Social Metrics Pro. It will allow you to track posts, pages, images, videos, portfolio items, custom directory pages, and more. That is where Easy Social Metrics Pro excels.
If you have any questions regarding Easy Social Metrics Pro, please leave a comment below :)
Thanks for reading.
Kevin