It is important to analyse your website traffic to get a better understanding of your website’s position. You will see how many people are visiting, where they are coming from, how long they stayed on your website, and much more.
The de-facto standard service for tracking website statistics is Google Analytics. I use it to track traffic on all of my websites. I am sure you do too.
Whilst I do find Google Analytics useful, I sometimes find it a pain to find the information I want as it provides a lot of stats I am not really interested in.
In the past I used the Jetpack WordPress.com Stats module; also known as Jetpack Site Stats. It gave me a lot of useful information about my visitors and it allowed me to check stats directly through the official WordPress mobile phone app.

The problem is that Jetpack Site Stats, like all traffic WordPress plugins, hurt performance. So in my quest for optimal website performance I disabled Jetpack Site Stats, despite liking the information it gave me.
I recently posted a question on Rise Forums asking whether there were any WordPress stat plugins that do not hurt performance and Rhys Wynne advised he still used Jetpack and thought it was pretty slick.
Does Jetpack Stats reduce page loading times significantly?
That is something I put to the test in the video below.

Want to read how Jetpack Stats affected my website’s performance? If so, keep reading on :)
Putting Jetpack WordPress.com Stats to the Test
Just like my recent reviews of WP Rocket and Perfmatters, I will do performance tests using the following three services: Pingdom, GTmetrix, and Google PageSpeed Insights.
Below you will find the scores for the home page of KevinMuldoon.com.
- Pingdom – Performance Grade: B (88%), Load Time: 761 milliseconds, Page Size: 509.3KB, Requests: 41
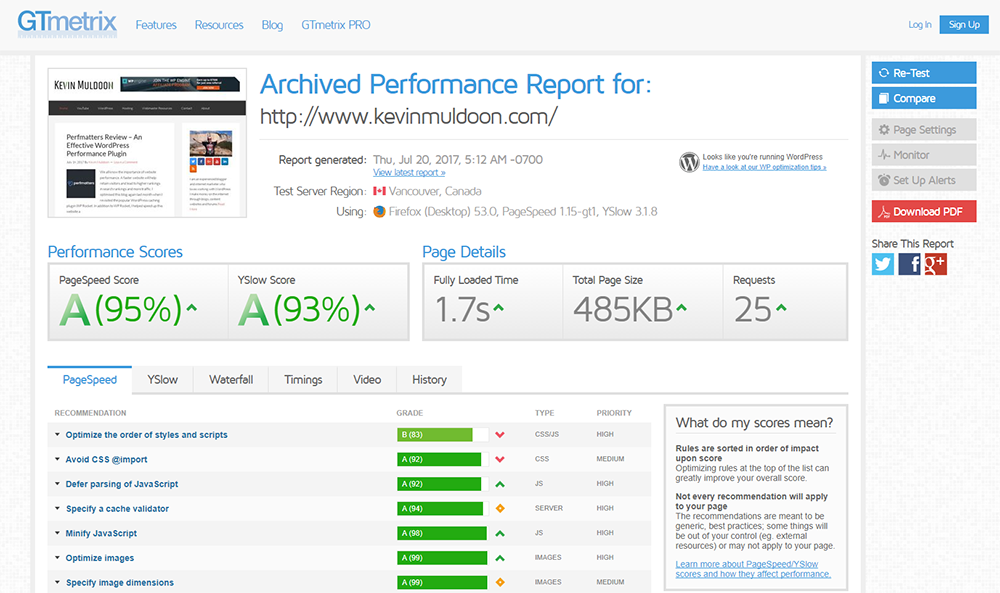
- GTmetrix – PageSpeed Score: A (95%), YSlow Score: A (93%), Load Time: 1.7 seconds, Page Size: 485KB, Requests: 25
- Google PageSpeed Insights: Mobile: 63, Desktop: 86
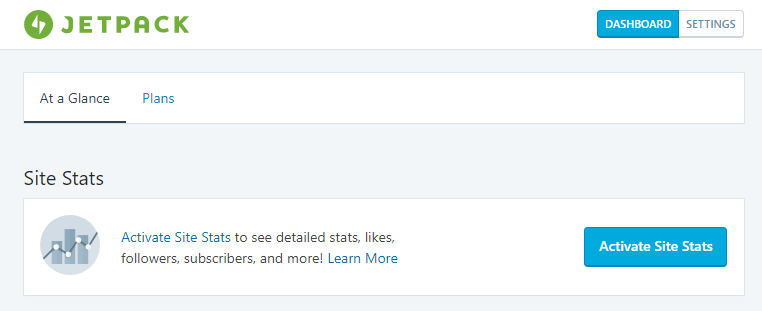
Activating Jetpack Site Stats is very simple. If it hasn’t yet been activated, it will be displayed prominently in the Jetpack dashboard.
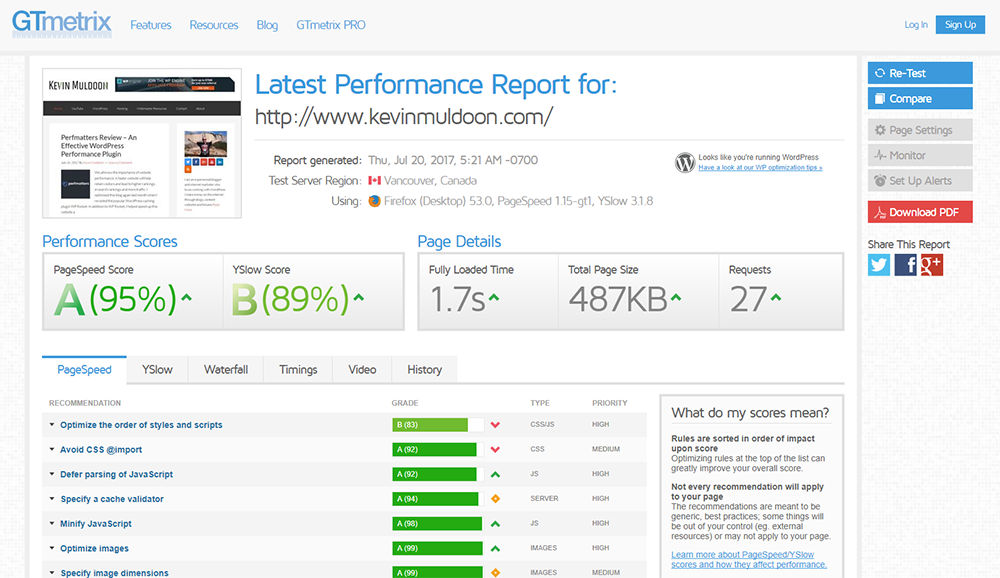
Once I activated Site Stats, I cleared the cache from WP Rocket and CloudFlare and did the performance tests again for my home page.
- Pingdom – Performance Grade: B (86%), Load Time: 574 milliseconds, Page Size: 514.7KB, Requests: 43
- GTmetrix – PageSpeed Score: A (95%), YSlow Score: B (89%), Load Time: 1.7 seconds, Page Size: 487KB, Requests: 27
- Google PageSpeed Insights: Mobile: 63, Desktop: 80
Google PageSpeed decreased the performance grade on Pingdom slightly and the YSlow score on GTMetrix by a few percent. That being said, performance did not really take a major hit.
Google PageSpeed Insights did show the desktop performance score decrease from an 86 out of 100 to an 80.
Jetpack Site Stats only appears to add a few kilobytes to a page and add two additional HTTP requests. For the functionality that Jetpack offers, that is a very small price to pay from a page loading point of view, though you will see your performance scores decrease a little.
Please bear in mind, however, that these results are based on a website that is optimised using WP Rocket, Autoptimize, Perfmatters, and CloudFlare’s CDN.
Those of you who have not optimised your website will see your page size and total number of requests increase by a higher amount. However, those of you who have not optimised your website are not making website optimisation a priority so this whole case study is irrelevant to you.
Deactivating Jetpack Modules is a Pain
Whilst activating Jetpack Site Stats is easy, disabling the module is purposefully difficult. Automattic require you to click on the debug link at the bottom of the page and then click on the link titled “Access the full list of Jetpack modules available on your site”. You will then be taken to a page where you can activate and deactivate modules.
For reference, you can go directly to the page by going to www.yourwebsite.com/wp-admin/admin.php?page=jetpack_modules.
Automattic have said that they have done this to simplify things; but all they are doing is making the process of managing modules more complicated.
Let’s be honest, this is a crappy way of making sure people keep Jetpack modules activated.
If anyone from Automattic is reading this, please do all you can to make module management simpler by reverting it to the way it should be. Hiding deactivation settings on the third page of a link that is displayed at the bottom of a page hurts usability, it does not help it.
Final Thoughts
Jetpack Site Stats is not a replacement for Google Analytics, but it does provide another great way of analysing your traffic directly from within your WordPress admin area, on WordPress.com, or from an official WordPress mobile app.
If you have optimised your WordPress website correctly, you should only see two additional HTTP requests and a few kilobytes added to your total page size.
On the grand scale of things, that is not a significant drop on website performance, though it is up to you to test Jetpack Site Stats and decide whether you think it is worth using or not.
I would love to hear your thoughts on this case study so please leave a comment below :)
Thanks for reading.
Kevin