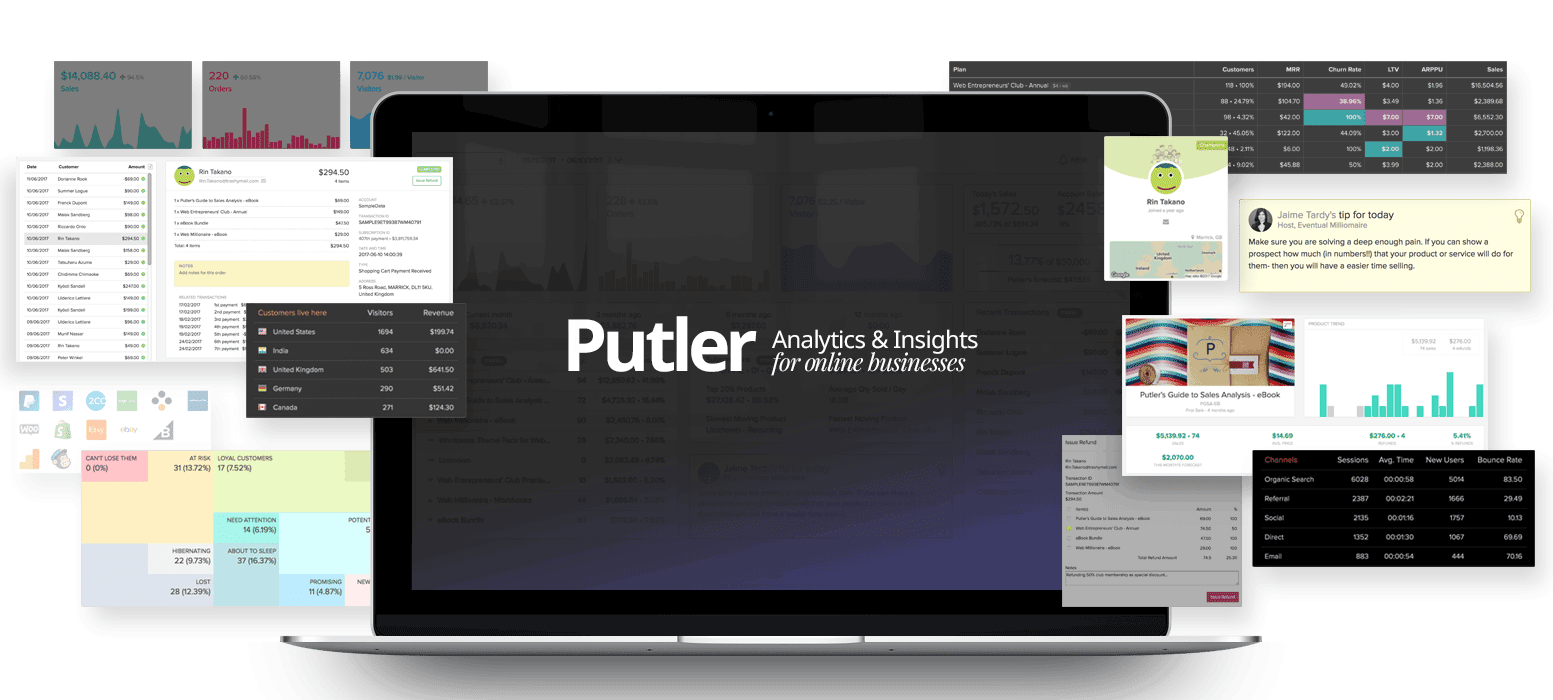
Putler is an online analytics service that was designed to help you understand your eCommerce business better.
It achieves this by connecting to all of your platforms, aggregating the data and presenting it to you in an uncomplicated way that is easy to understand.
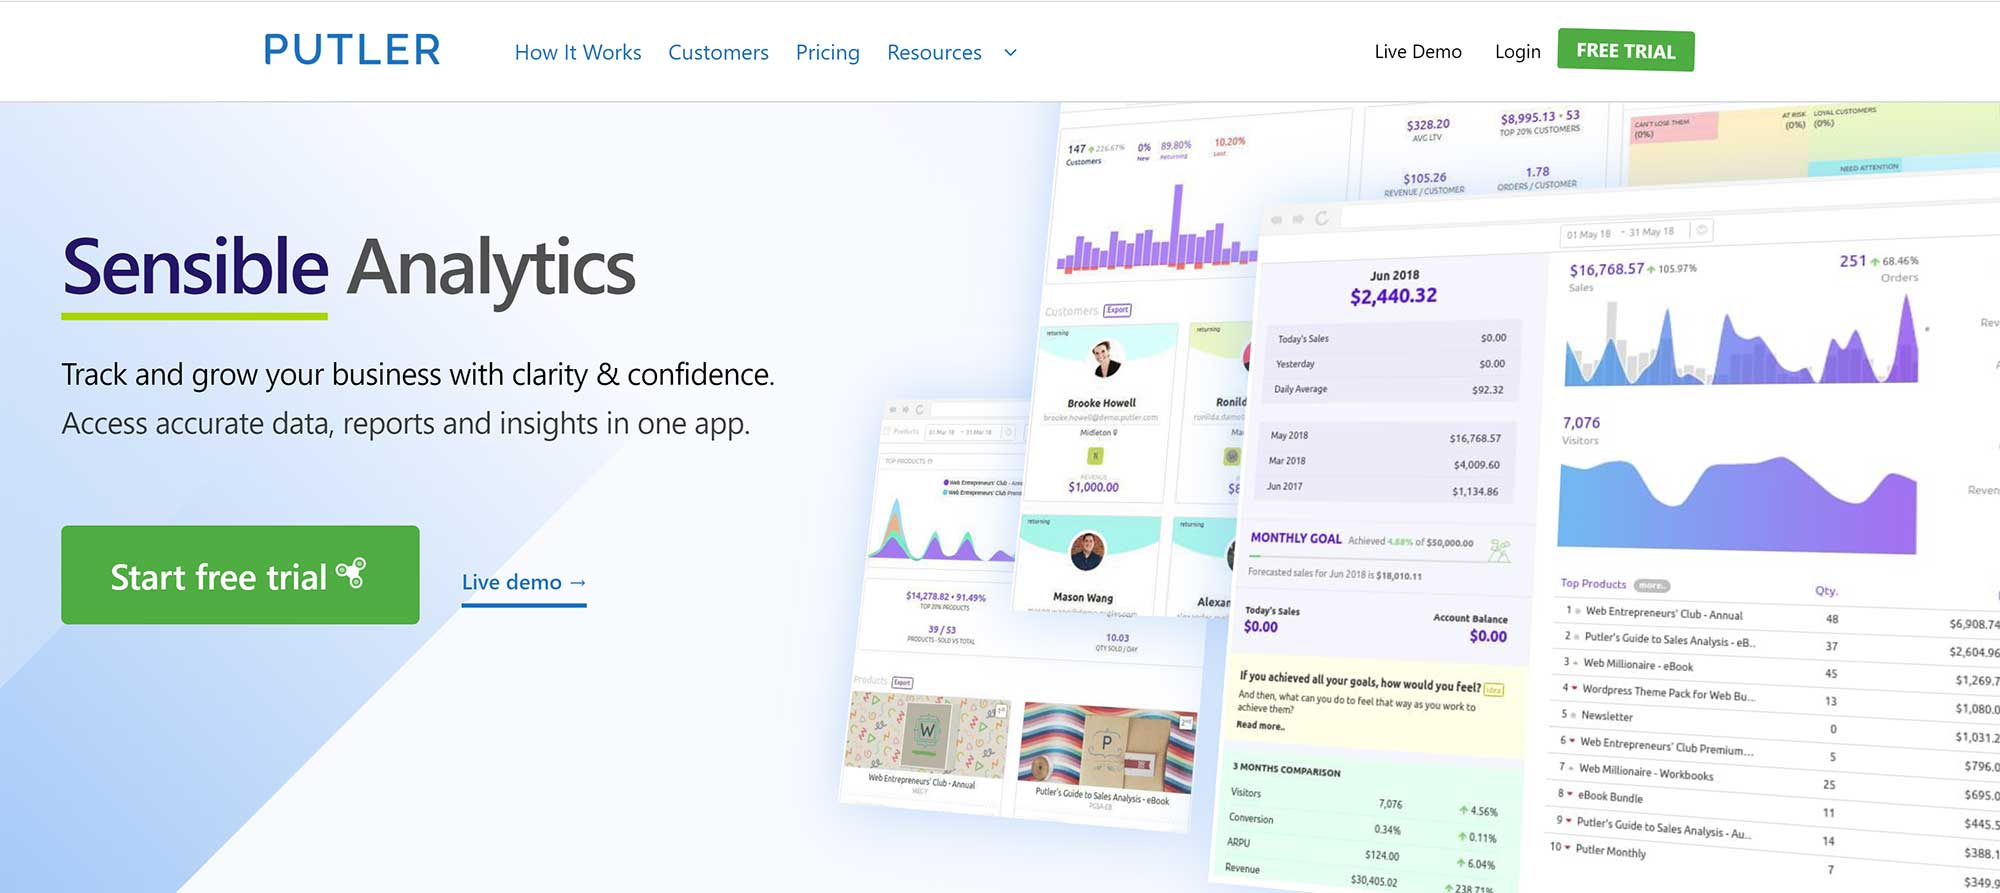
In this article, I would like to take a close look at Putler and how the service can help you and your online shop.
Special Offer
Between 22nd November and 3 December 2019, Putler are offering 20% off all of their plans. Check out my pricing section at the end for more details :)
How Does Putler Work?
Putler was created so that complex reports and graphs could be simplified so that only relevant data is shown to you.
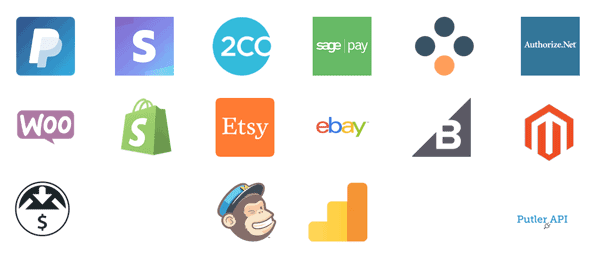
To do this, Putler integrates with many popular online platforms.
- Payment Gateways – PayPal, Stripe, Authorize.net, SagePay, 2Checkout and Braintree
- Shopping Carts & Ecommerce Systems – Shopify, WooCommerce, BigCommerce, EasyDigitalDownloads, eBay, Etsy and Gumroad
- Analytics & Email Marketing – Google Analytics and MailChimp
The Putler API can also be used to retrieve data from other online platforms.
Putler uses many filters and aggregation techniques to manage the data that is imported. This allows them to automatically remove duplidate information and convert currencies and time zones when needed.
153 relevant metrics are displayed in the member area. This includes traffic statistics, conversions, engagement, trending products, top selling products, payment status, subscriptions, and more.
These metrics help you build up detailed customer profiles that help you understand them better.
All of this data can be exported in CSV format or synced with your email list or to Facebook for an ad campaign.
It is worth noting that Putler is not just a reporting service. Many administrative tasks can be performed directly from the Putler dashboard. This includes issuing customer refunds, managing memberships, sending money, and filling orders. Tasks can also be delegated to staff to process.
Using Putler to Understand Your Business Better
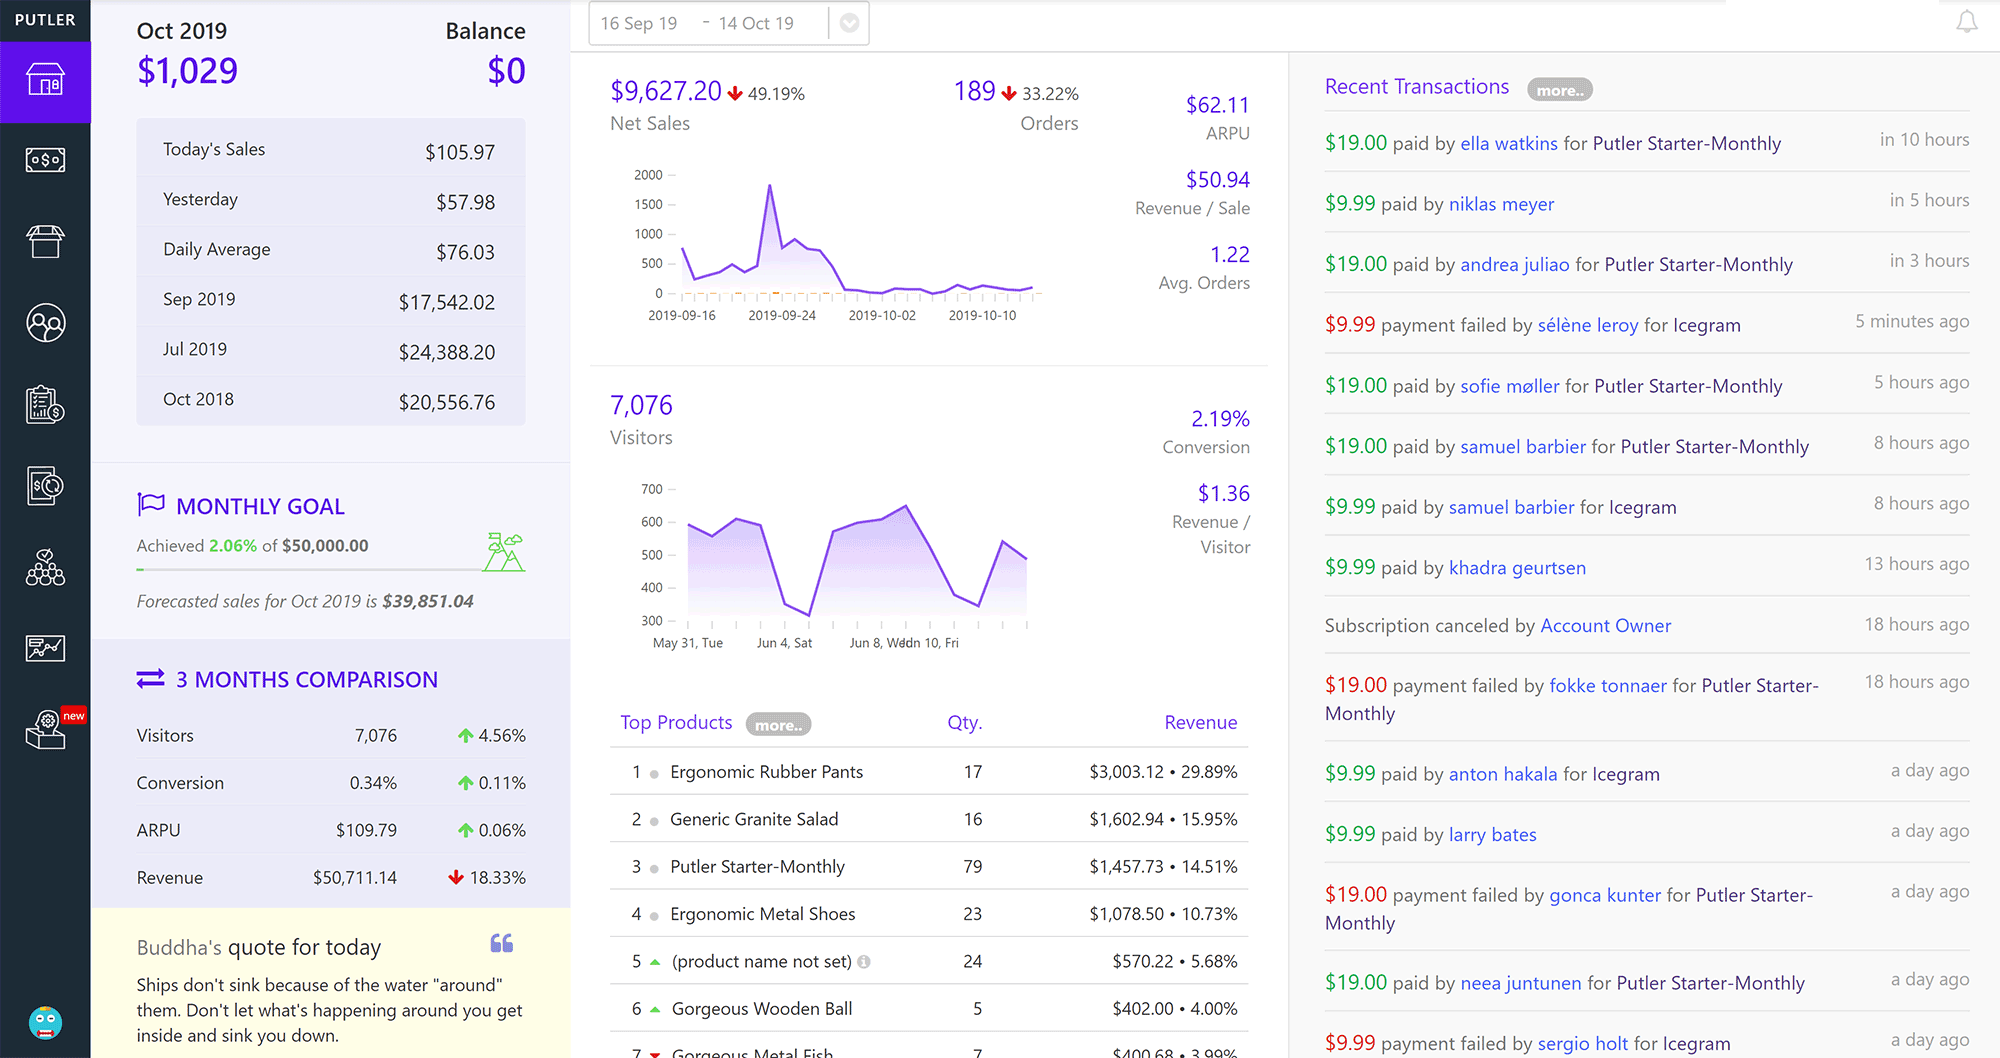
Putler boasts a simple user-interface.
The main navigation menu divides reports into main sections: Home, Sales, Products, Customers, Transactions, Subscriptions, Audience, Time Machine and Insights. A settings area which has several configuration sections is listed at the bottom of the menu.
At the top of each page is a dropdown menu which allows you to select from a custom time period or one of many pre-defined time peripds e.g. day, week, month, year etc.
The main dashboard will give you an overview of your company’s performance. It shows recent performance, orders, net sales, website traffic, top products, and recent transactions. It also shows your monthly goal and a three month comparison.
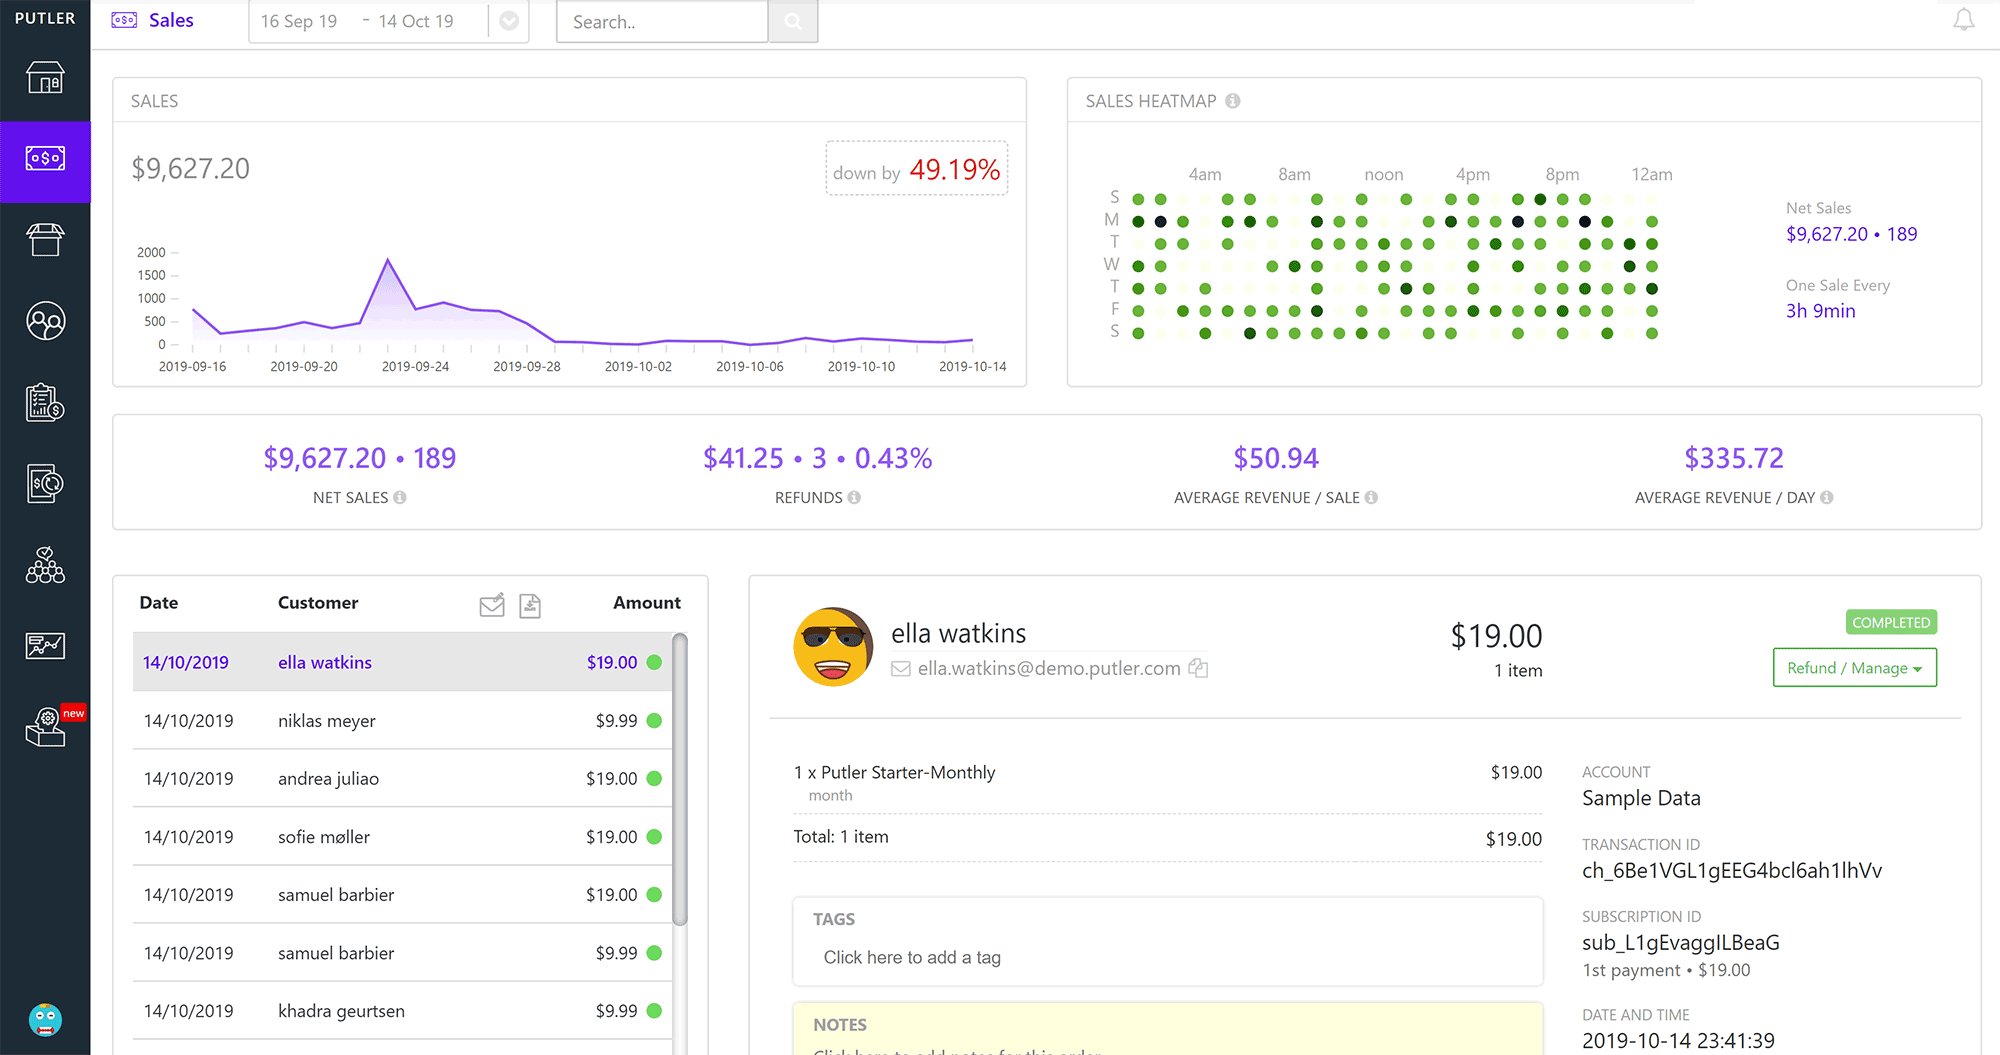
The sales area gives you a great overview of recent sales. It shows metrics such as net sales, refunds and average revenue per day. The heatmap at the top of the page will help you see which time of the day you are generating the most sales.
A list of recent customers is also displayed. By clicking on a particular customer you can see their profile. In addition to seeing the customer’s other transactions and address etc, you can actually refund the order directly from here.
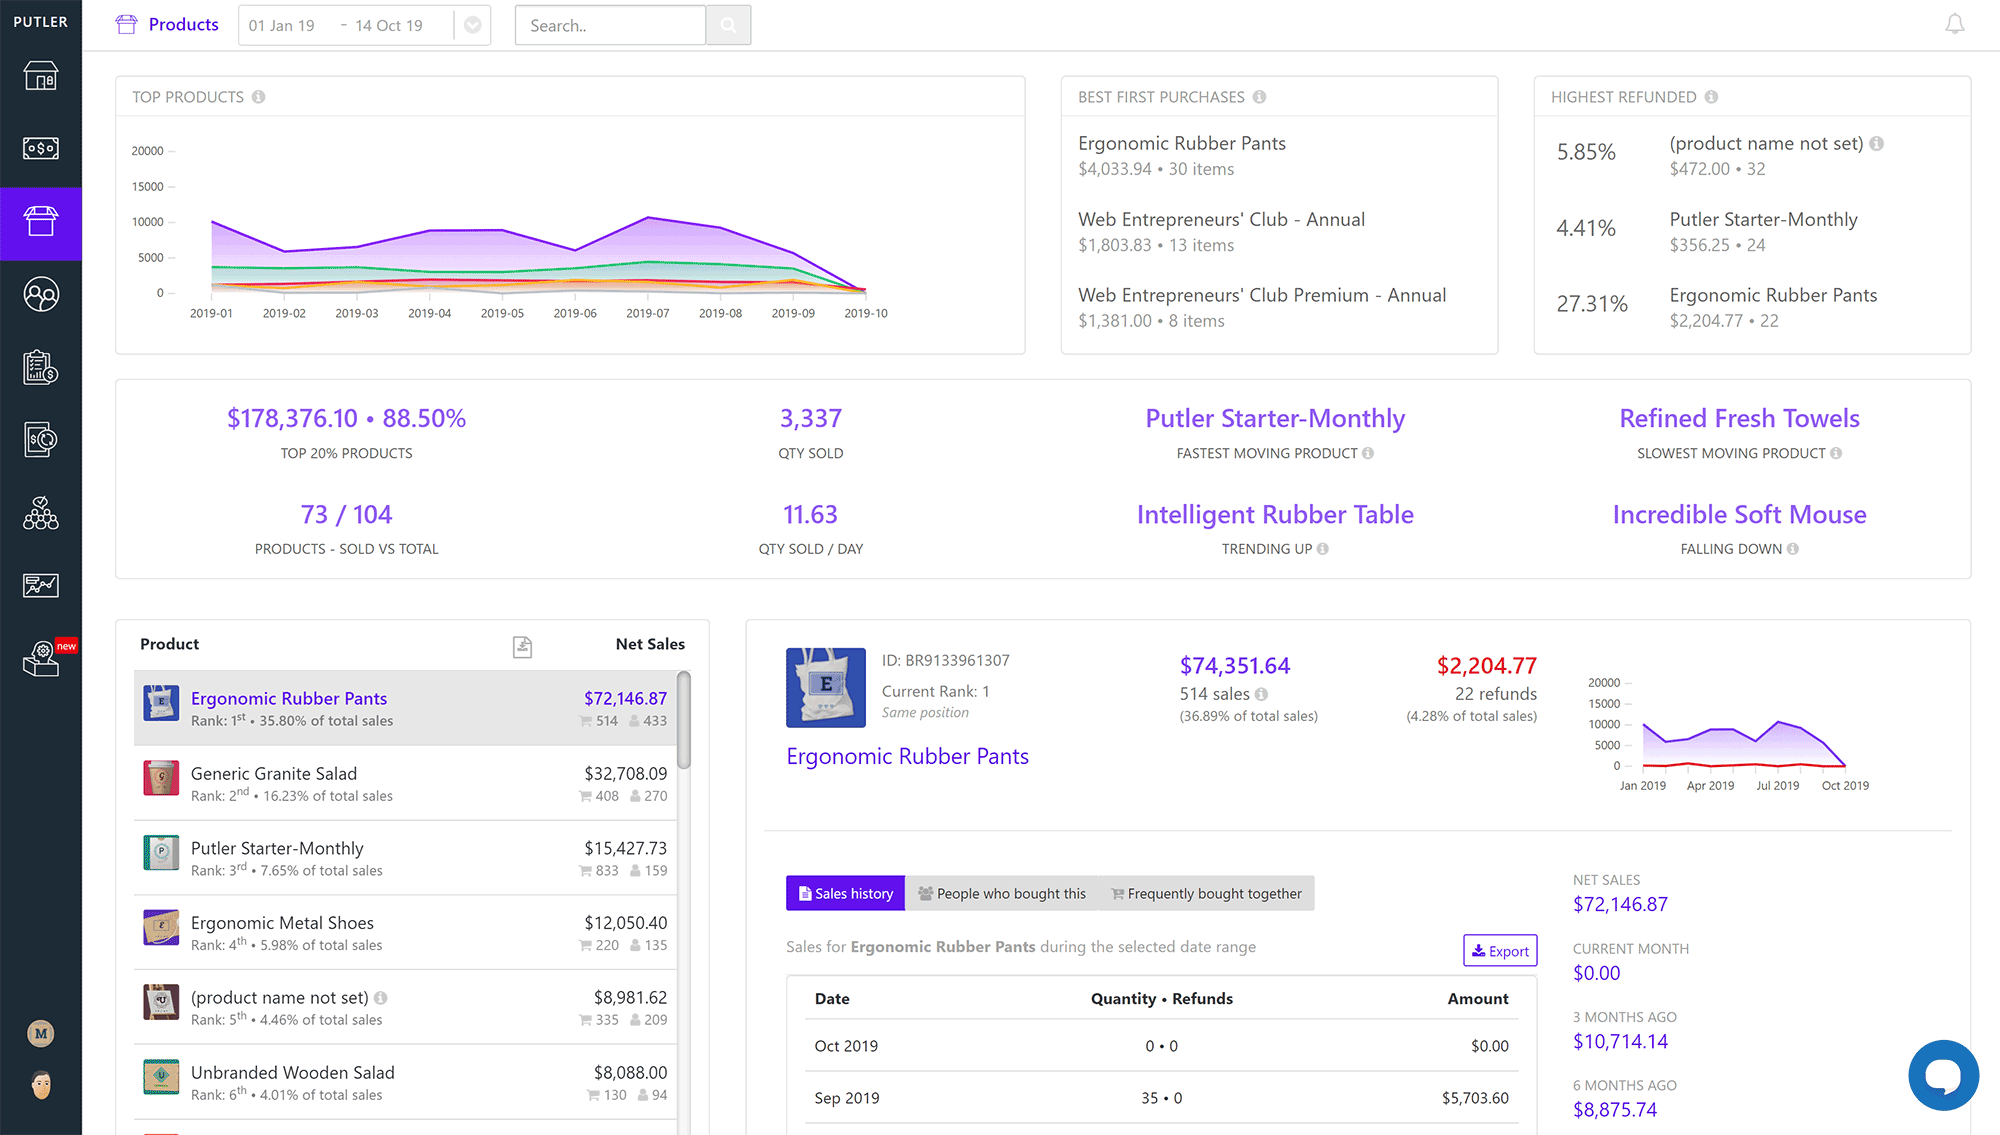
The products page helps break down sales information further by detailing exactly which products are being sold.
There are some useful metrics here, such as the top 20% of products being responsible for X percent of your total sales. Clicking on a product will break down its sales this month and previous months.
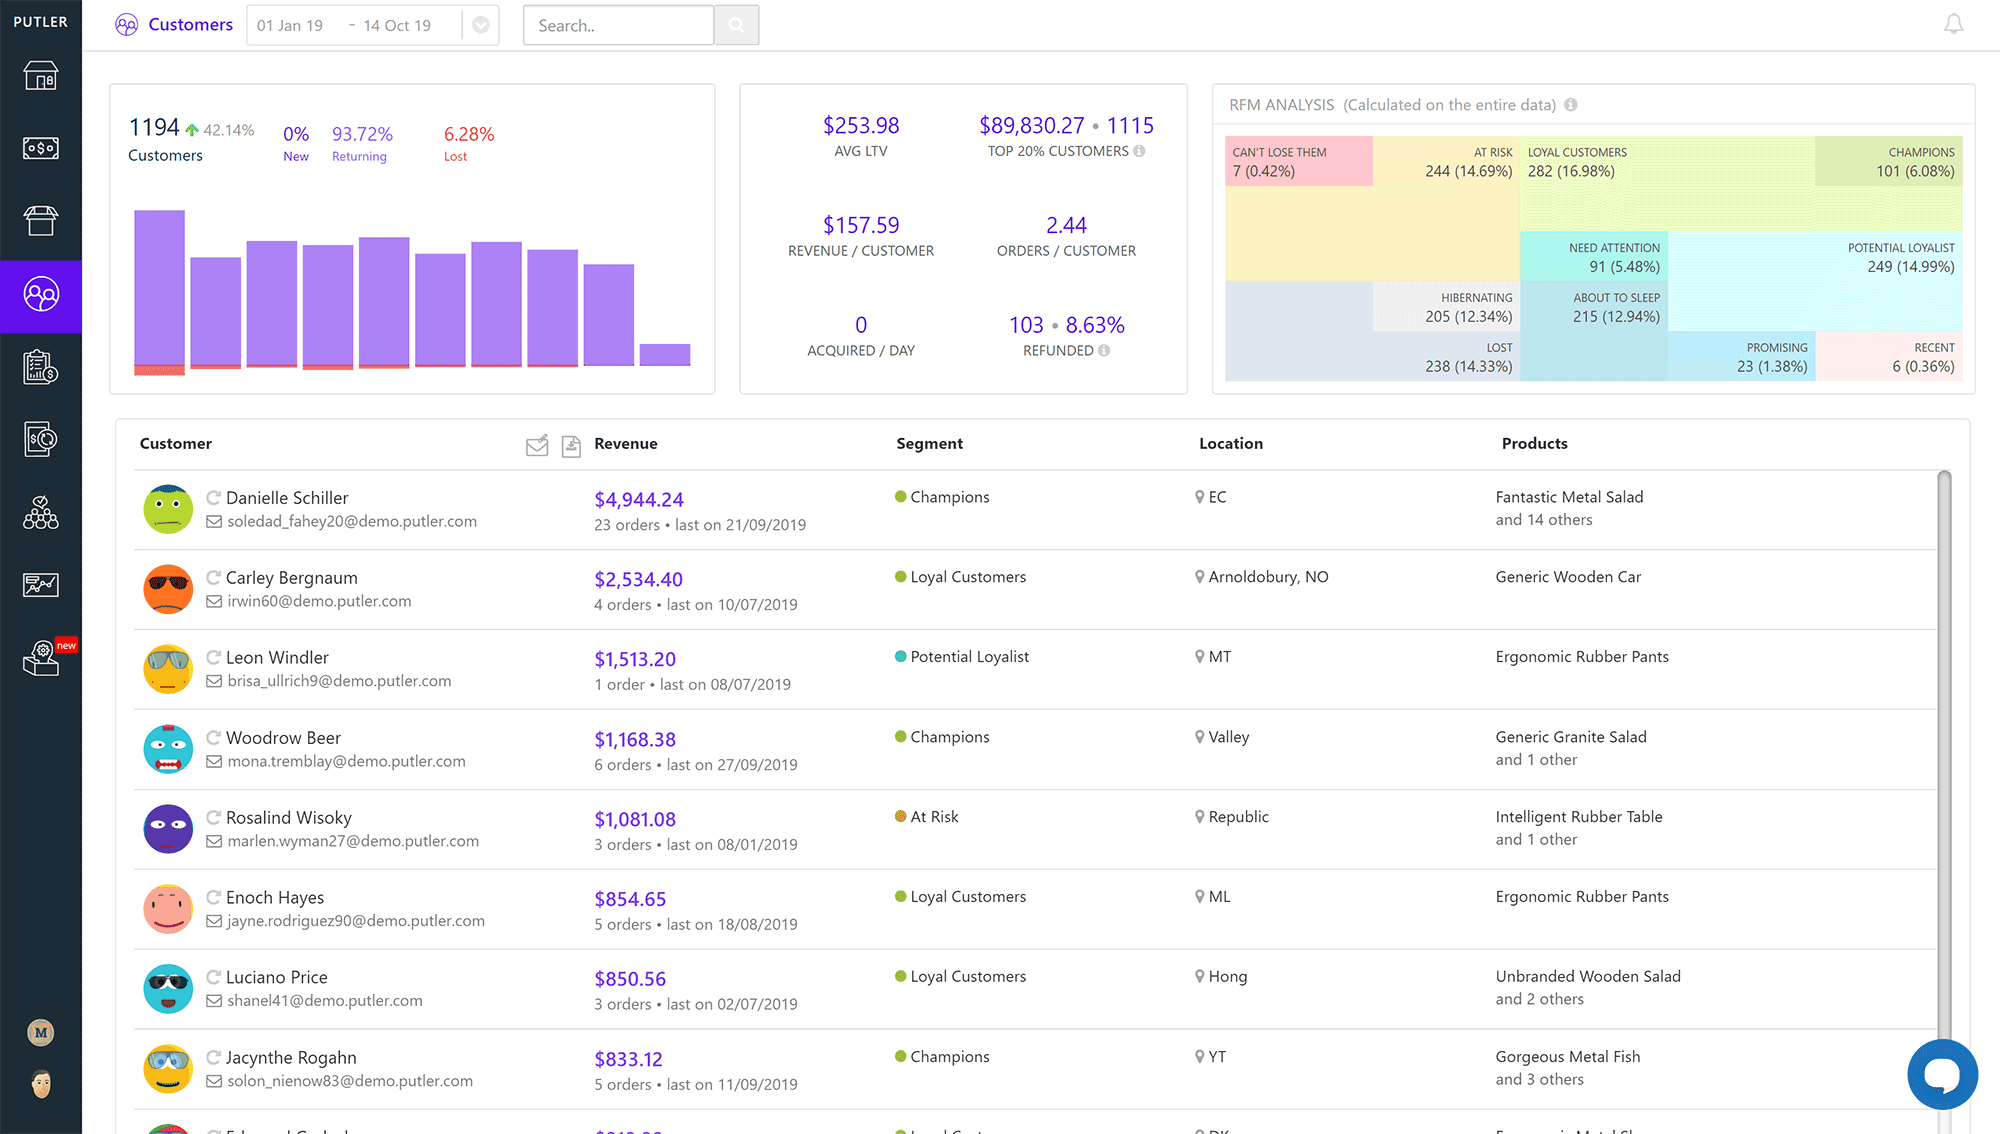
One of the best features of Putler is that it looks at your customer base and ranks them by importance. You will be able to see how much revenue each customer has generated and then categories them accordingly.
The RFM Analayis box helps break this information down and shows you what percent of customers you can’t lose, which customers are loyal, which are promising, which are lost, and more.
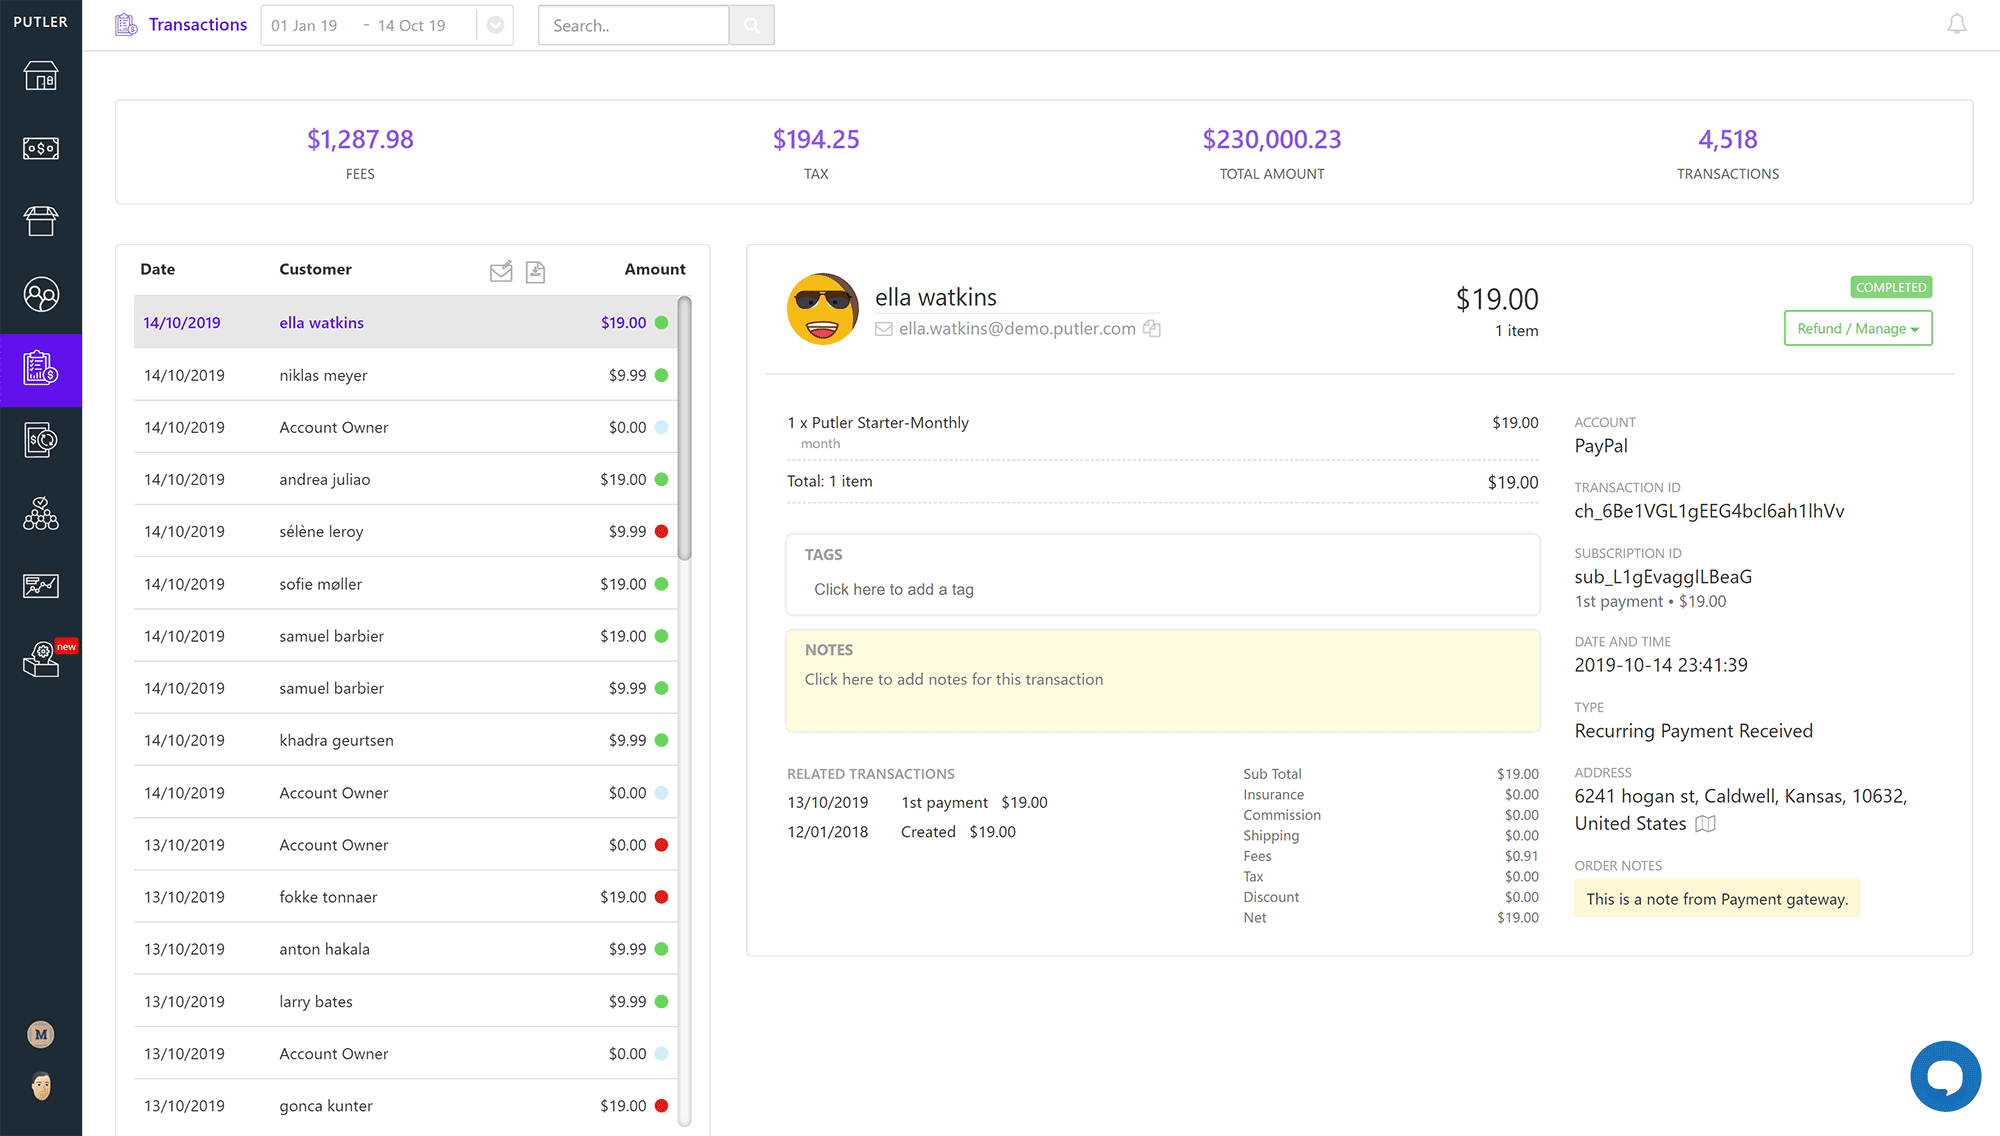
The transactions page will give you a detailed look at product orders.
A snapshot of this information is displayed in the sales page, but this area lists all transactions.
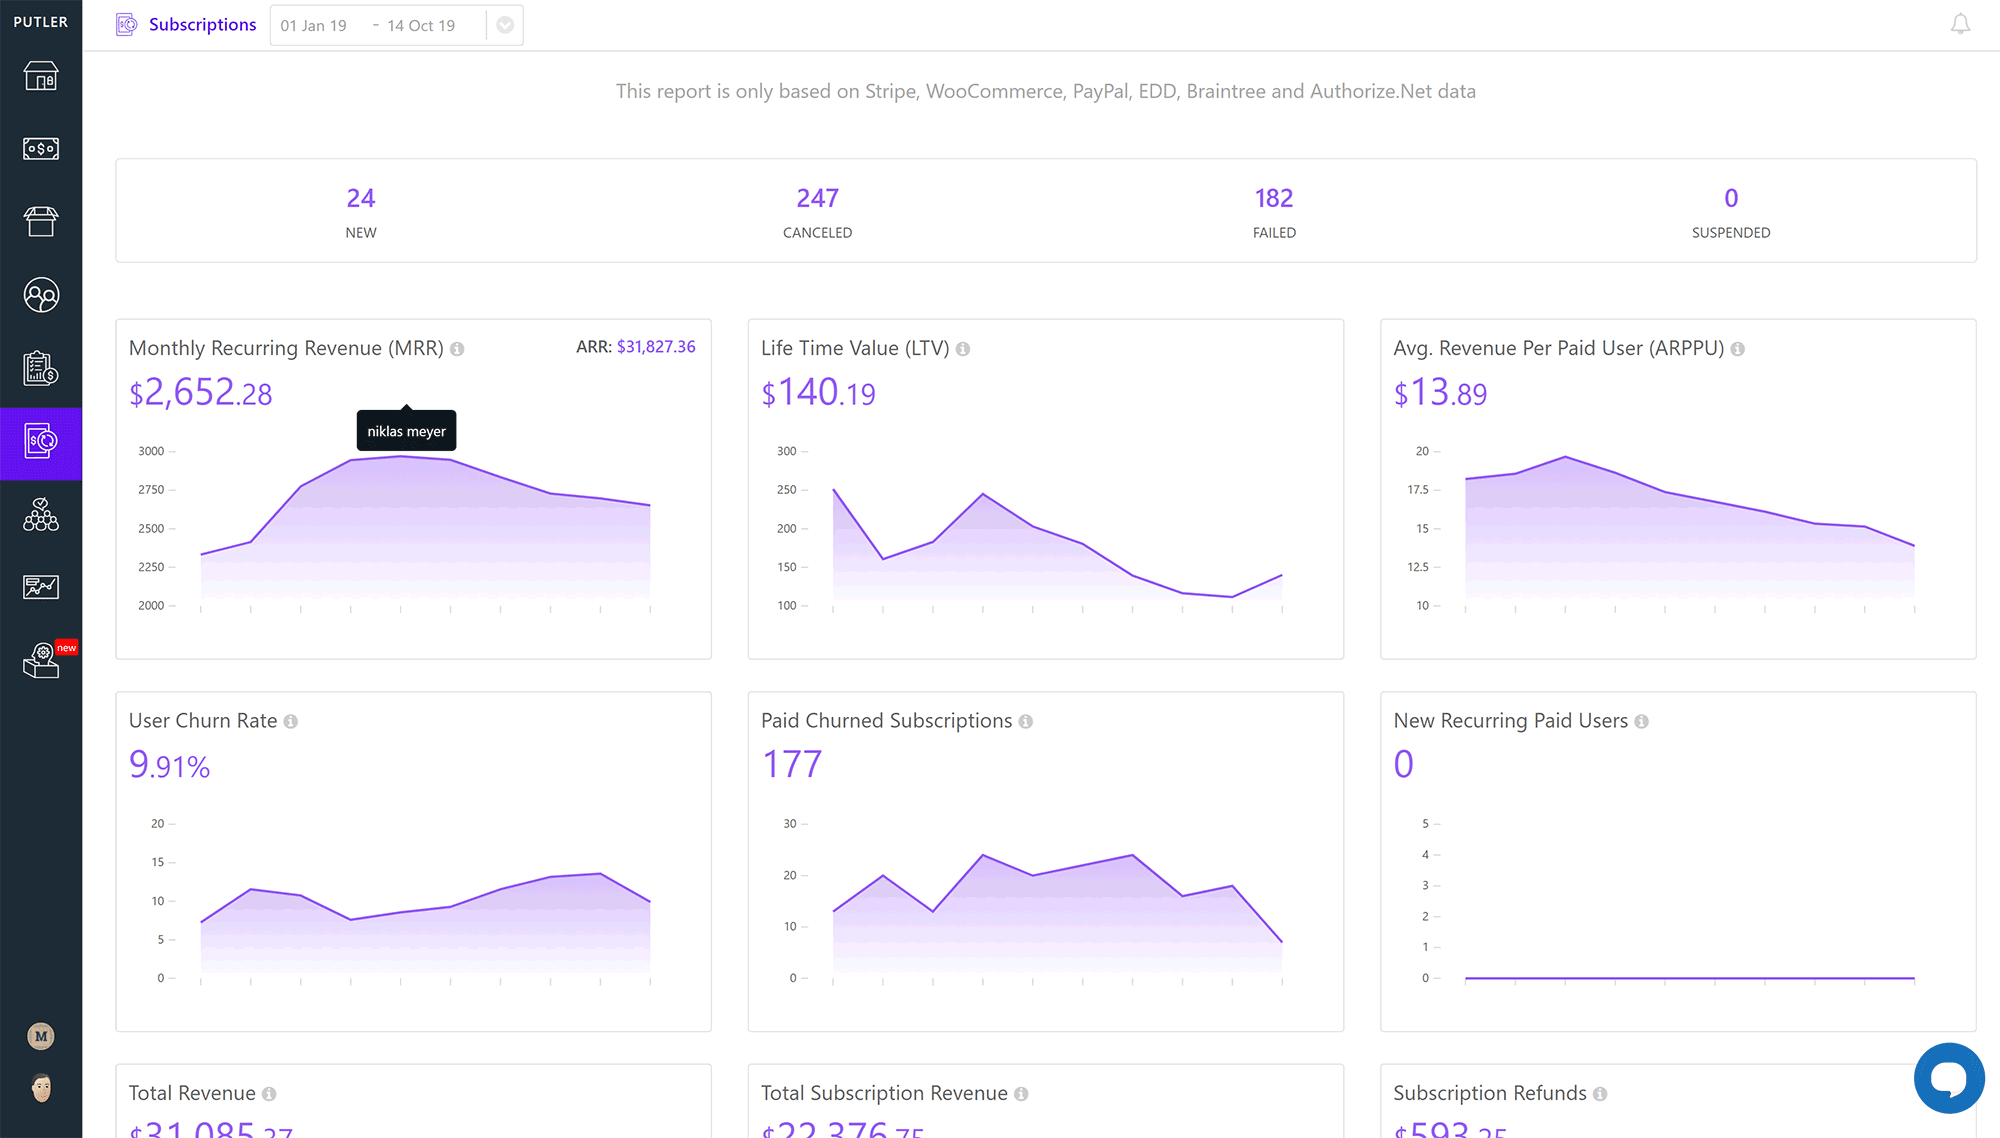
The subscriptions page pulls data from Stripe, WooCommerce, PayPal, EDD, Braintree and Authorize.Net.
It shows metrics such as monthly recurring revenue, lifetime value, user churn rate, total subscription revenue, subscription refunds, and more.
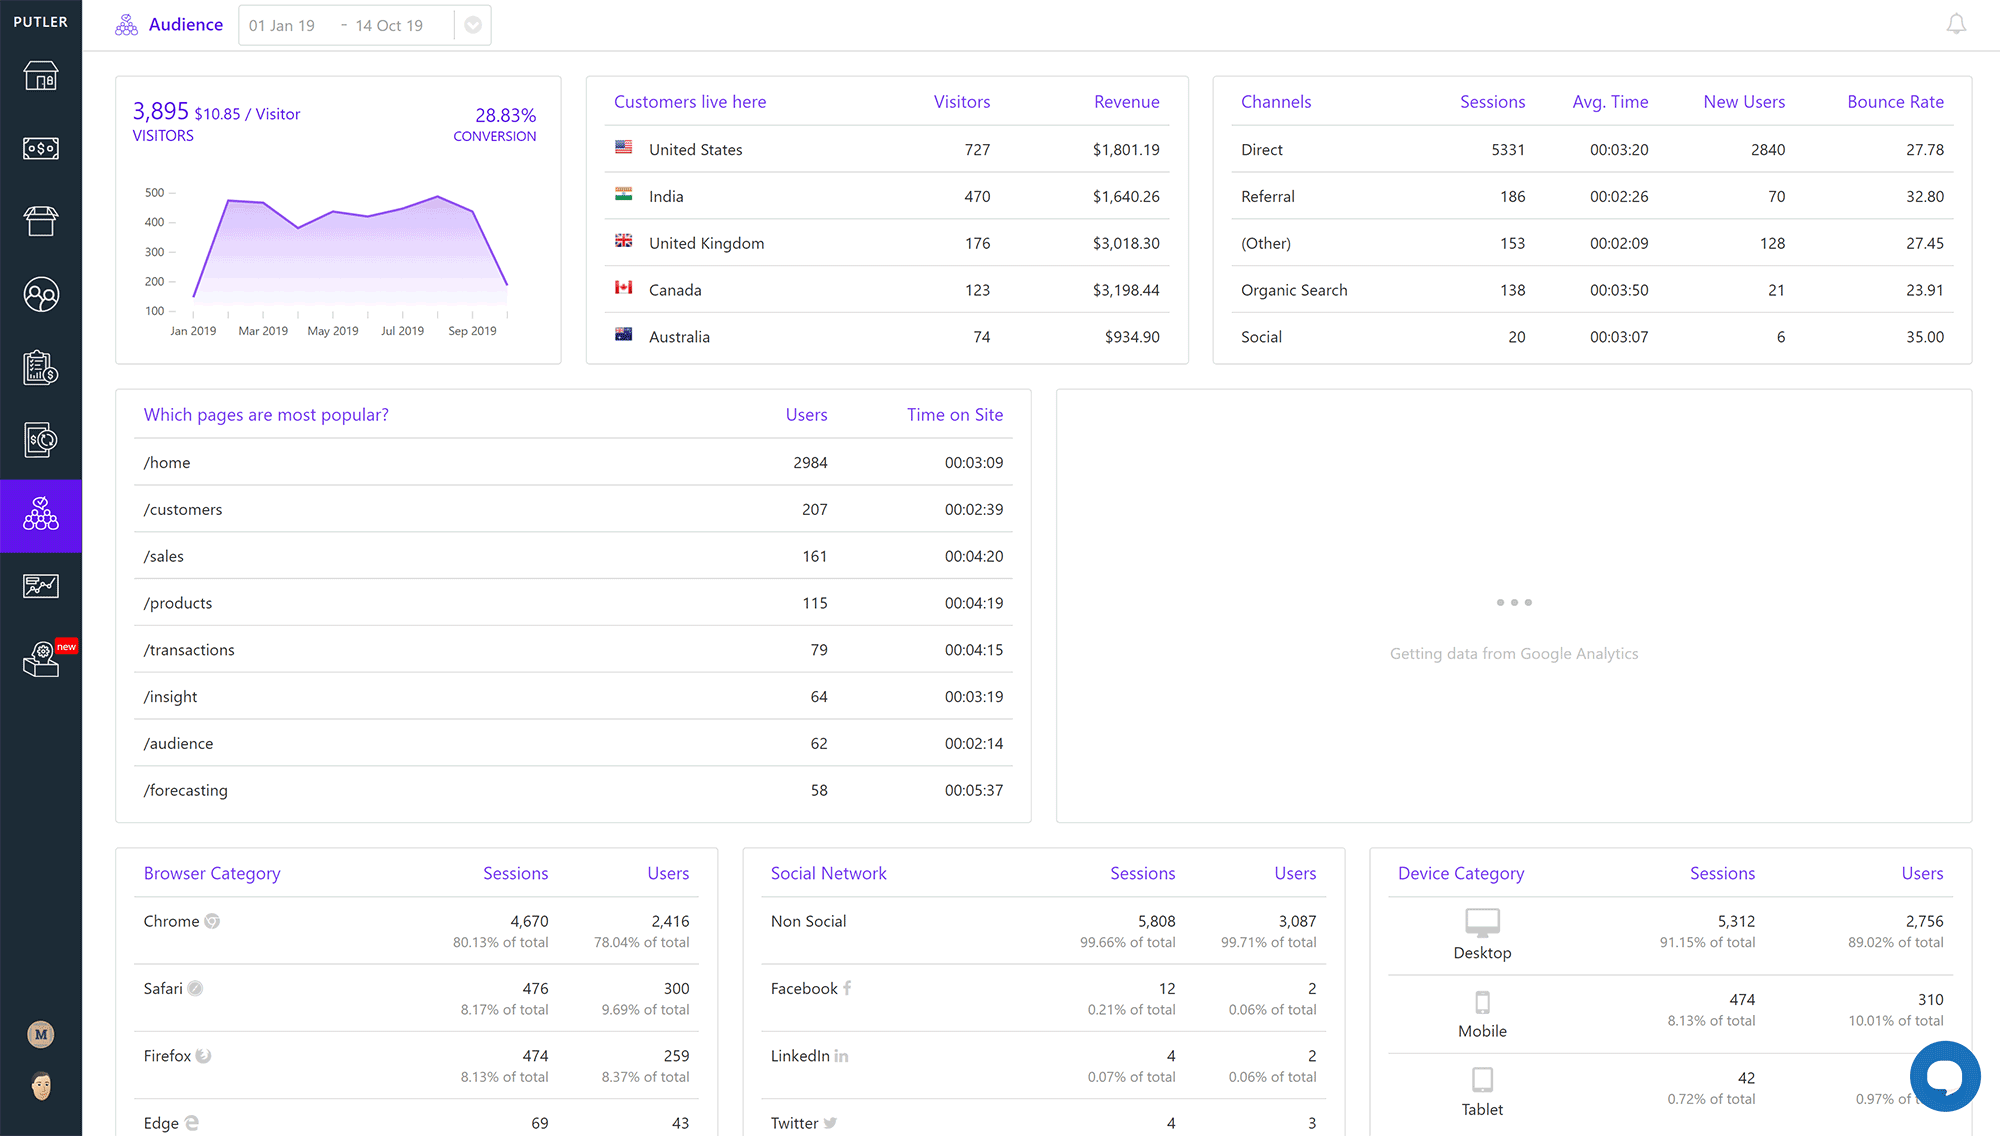
The audience page will help you understand your customers better.
It shows the revenue generated per visitor, where customers live, how those customers landed on your website and which pages are popular on your website.
Information about the device and browser the customer used is displayed too. It also shows whether customers landed on your website from a social media network.
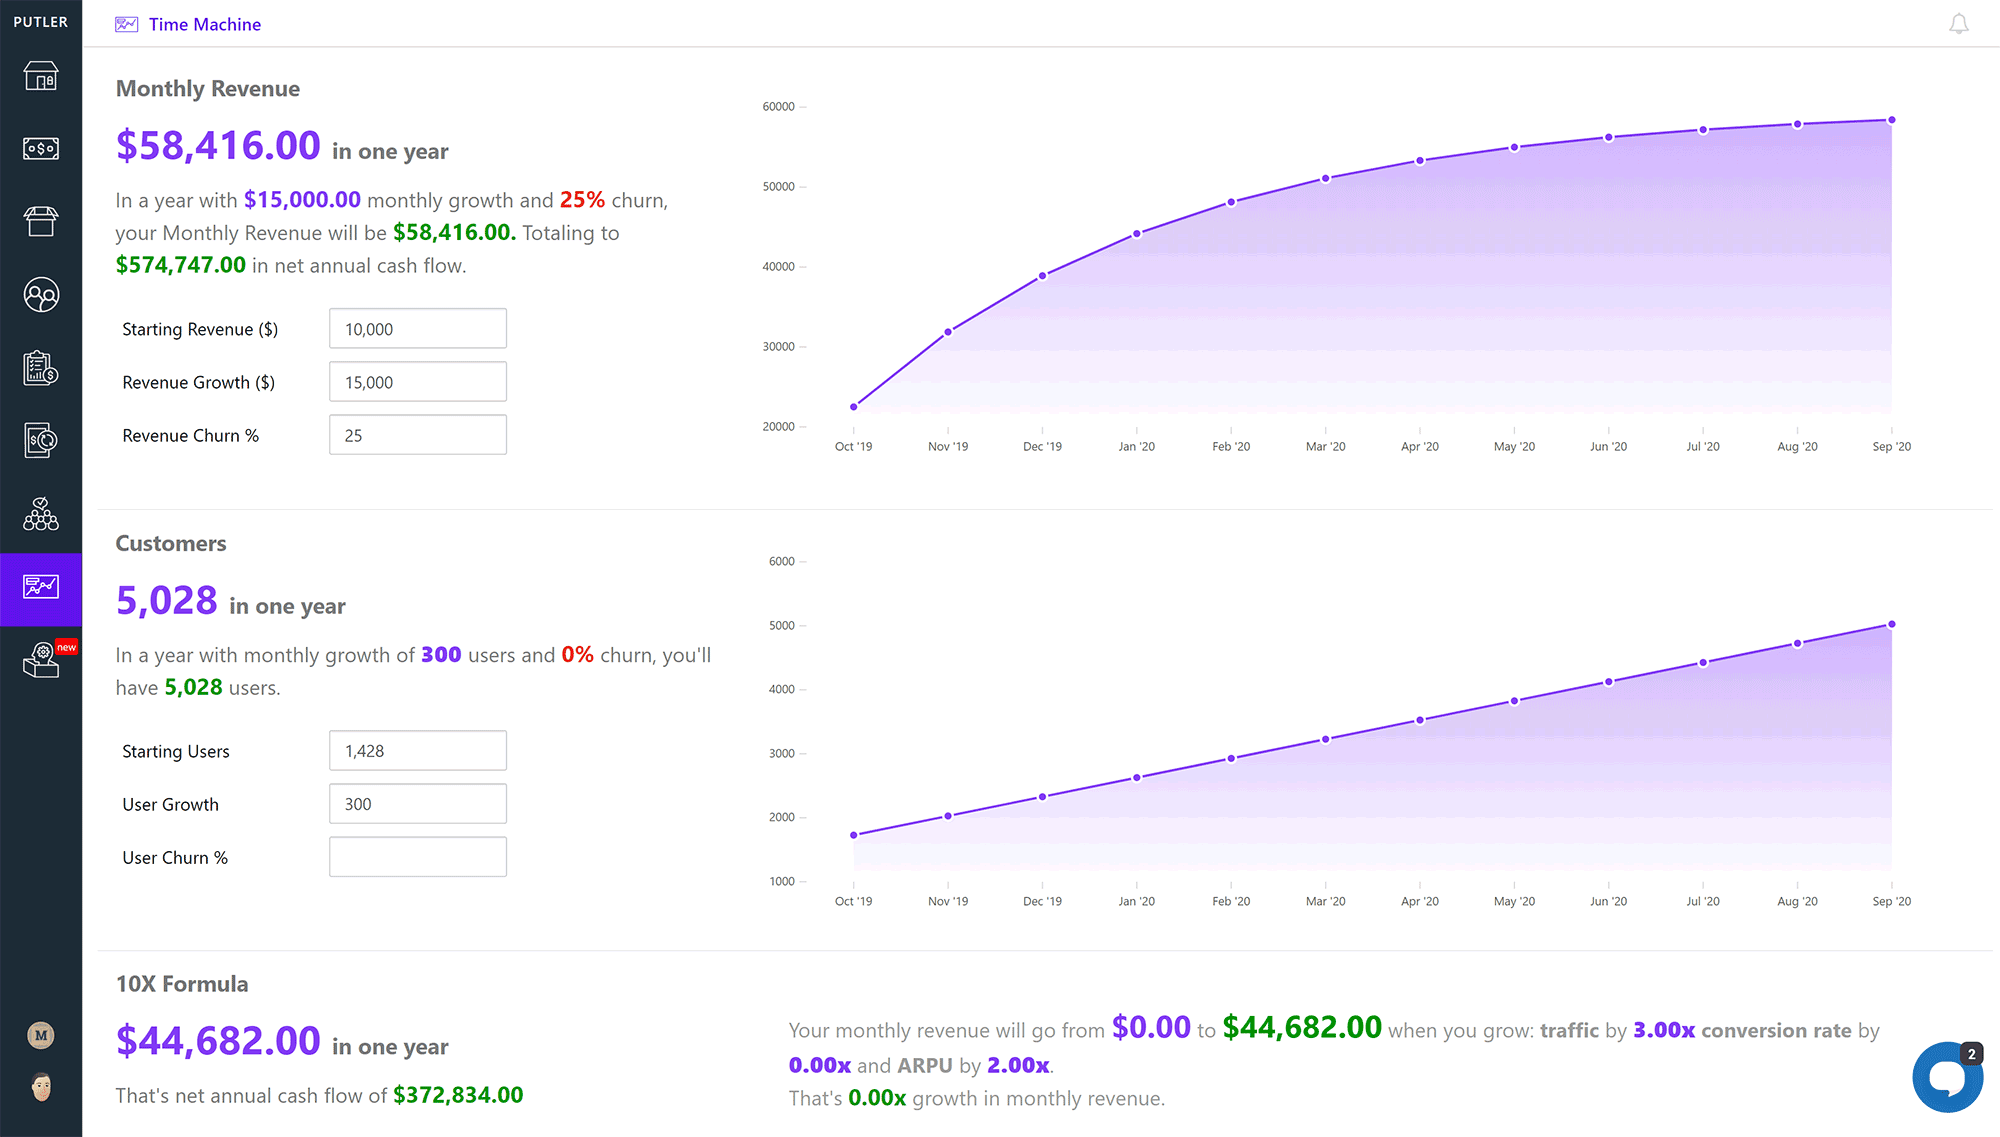
The time machine page contains three calculators: Monthly revenue, customers and 10X Formula.
By plugging values into these fields, you can project how much you can potentially earn under many given circumstances. For example, you could use it to predict how revenue will drop if you lose customers.
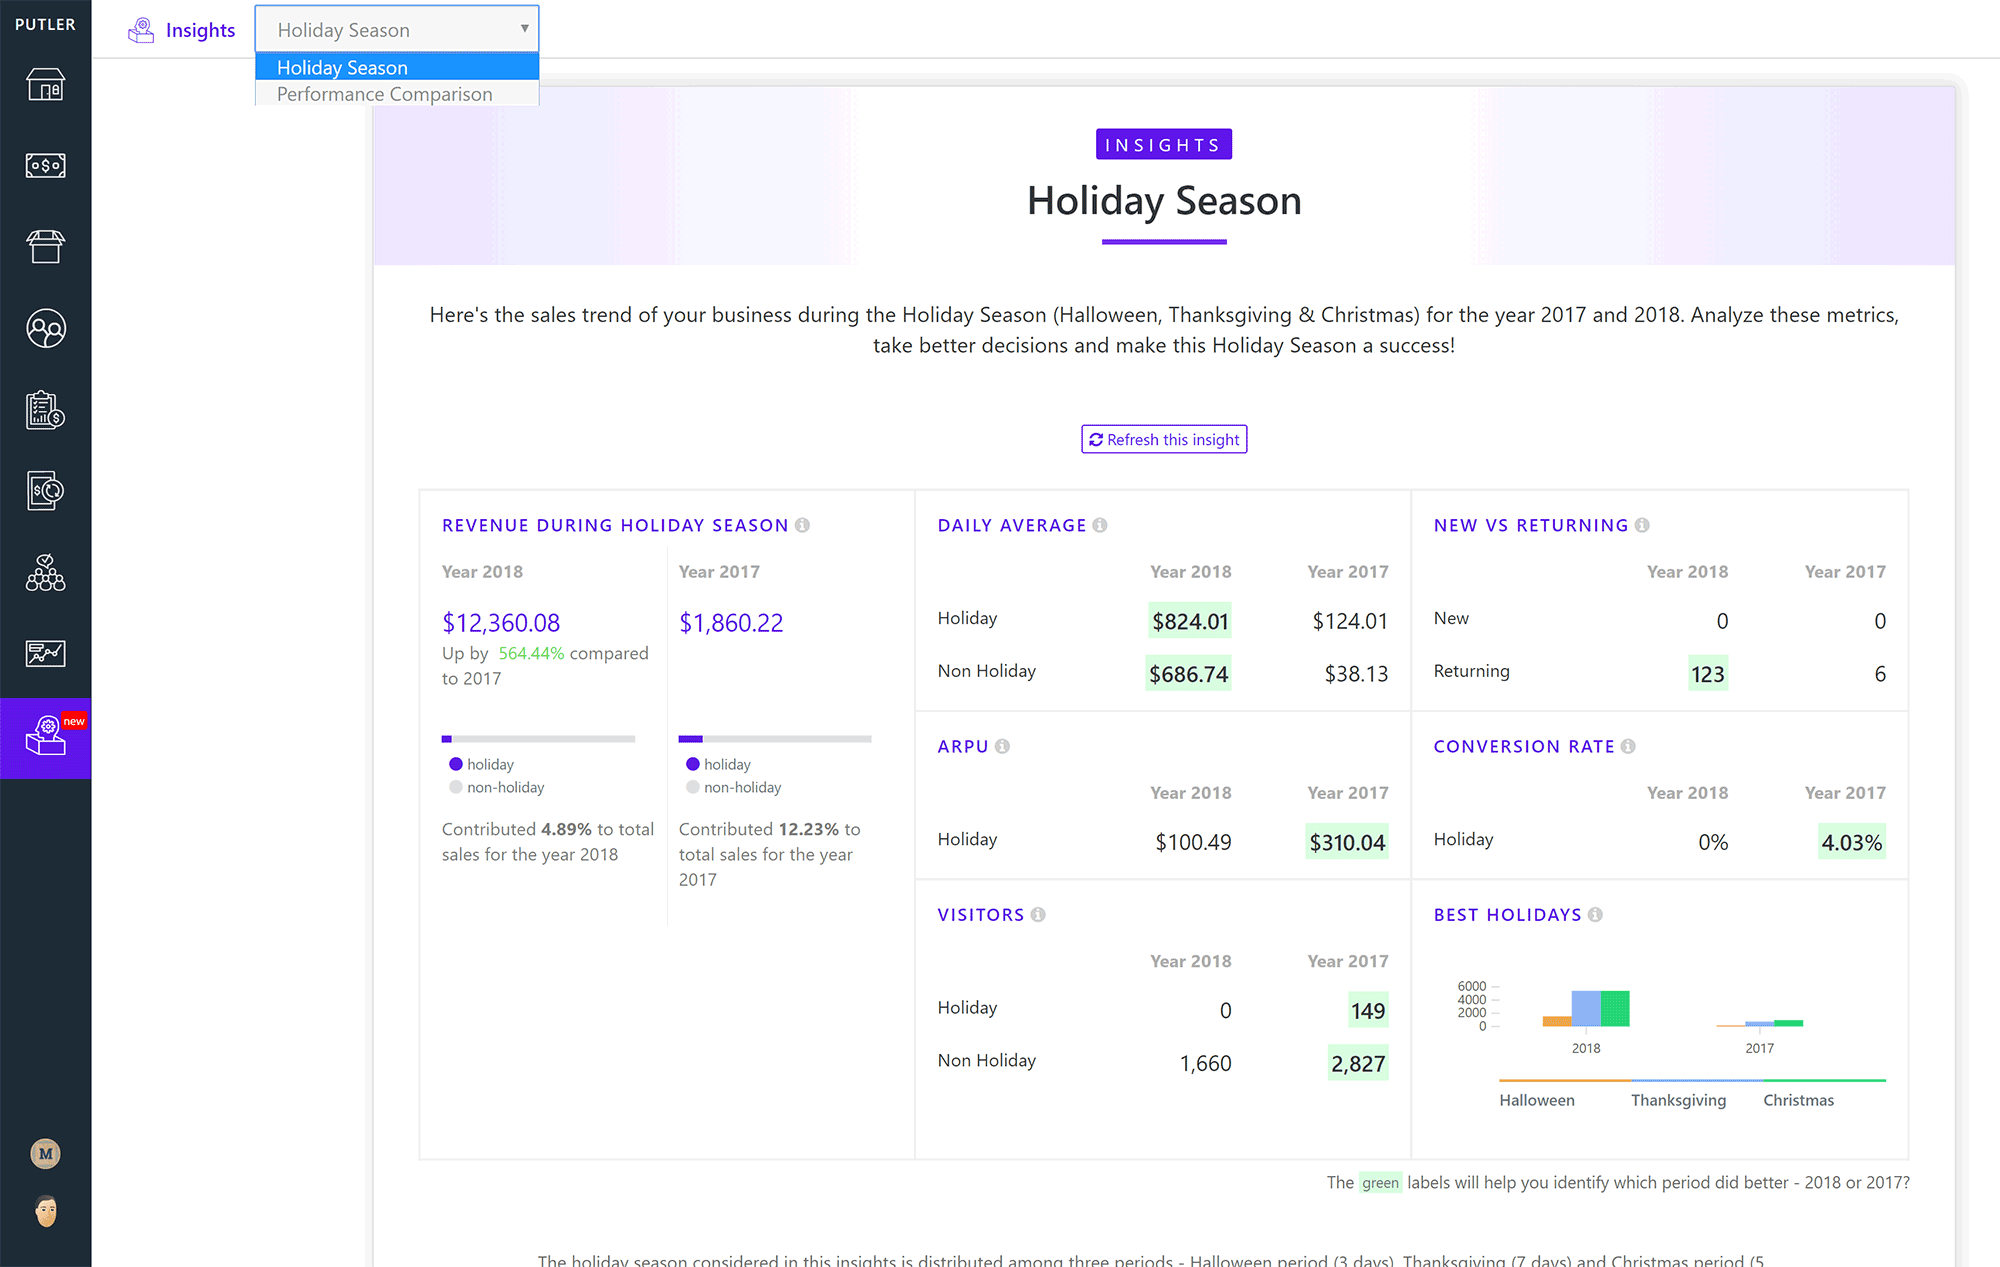
The last page in the Putler member area is insights.
Insights breaks down performance during holiday periods such as Halloween, Easter and Christmas. It’s a useful tool for seeing how sales have increased over a specific time period.
I found the Putler member area to be simple to navigate.
What they have essentially done is pull relevant data from sources like Shopify and Google Analytics and curate the most important details. This can be essential when making important company decisions.
How Much Does Putler Cost?
The cost of using Putler will depend on how many orders your business processes every month.
The $29 per month starter plan supports 300 orders per month. This plan lets you connect two platforms and view two years of historical data.
The growth plan retails at $79 per month. This plan allows up to 3,000 orders per month and lets you connect up to seven platforms. Five years of historical data can be accessed on this plan and you gain access to personalised growth recommendations, inbound and outbound API access and more.
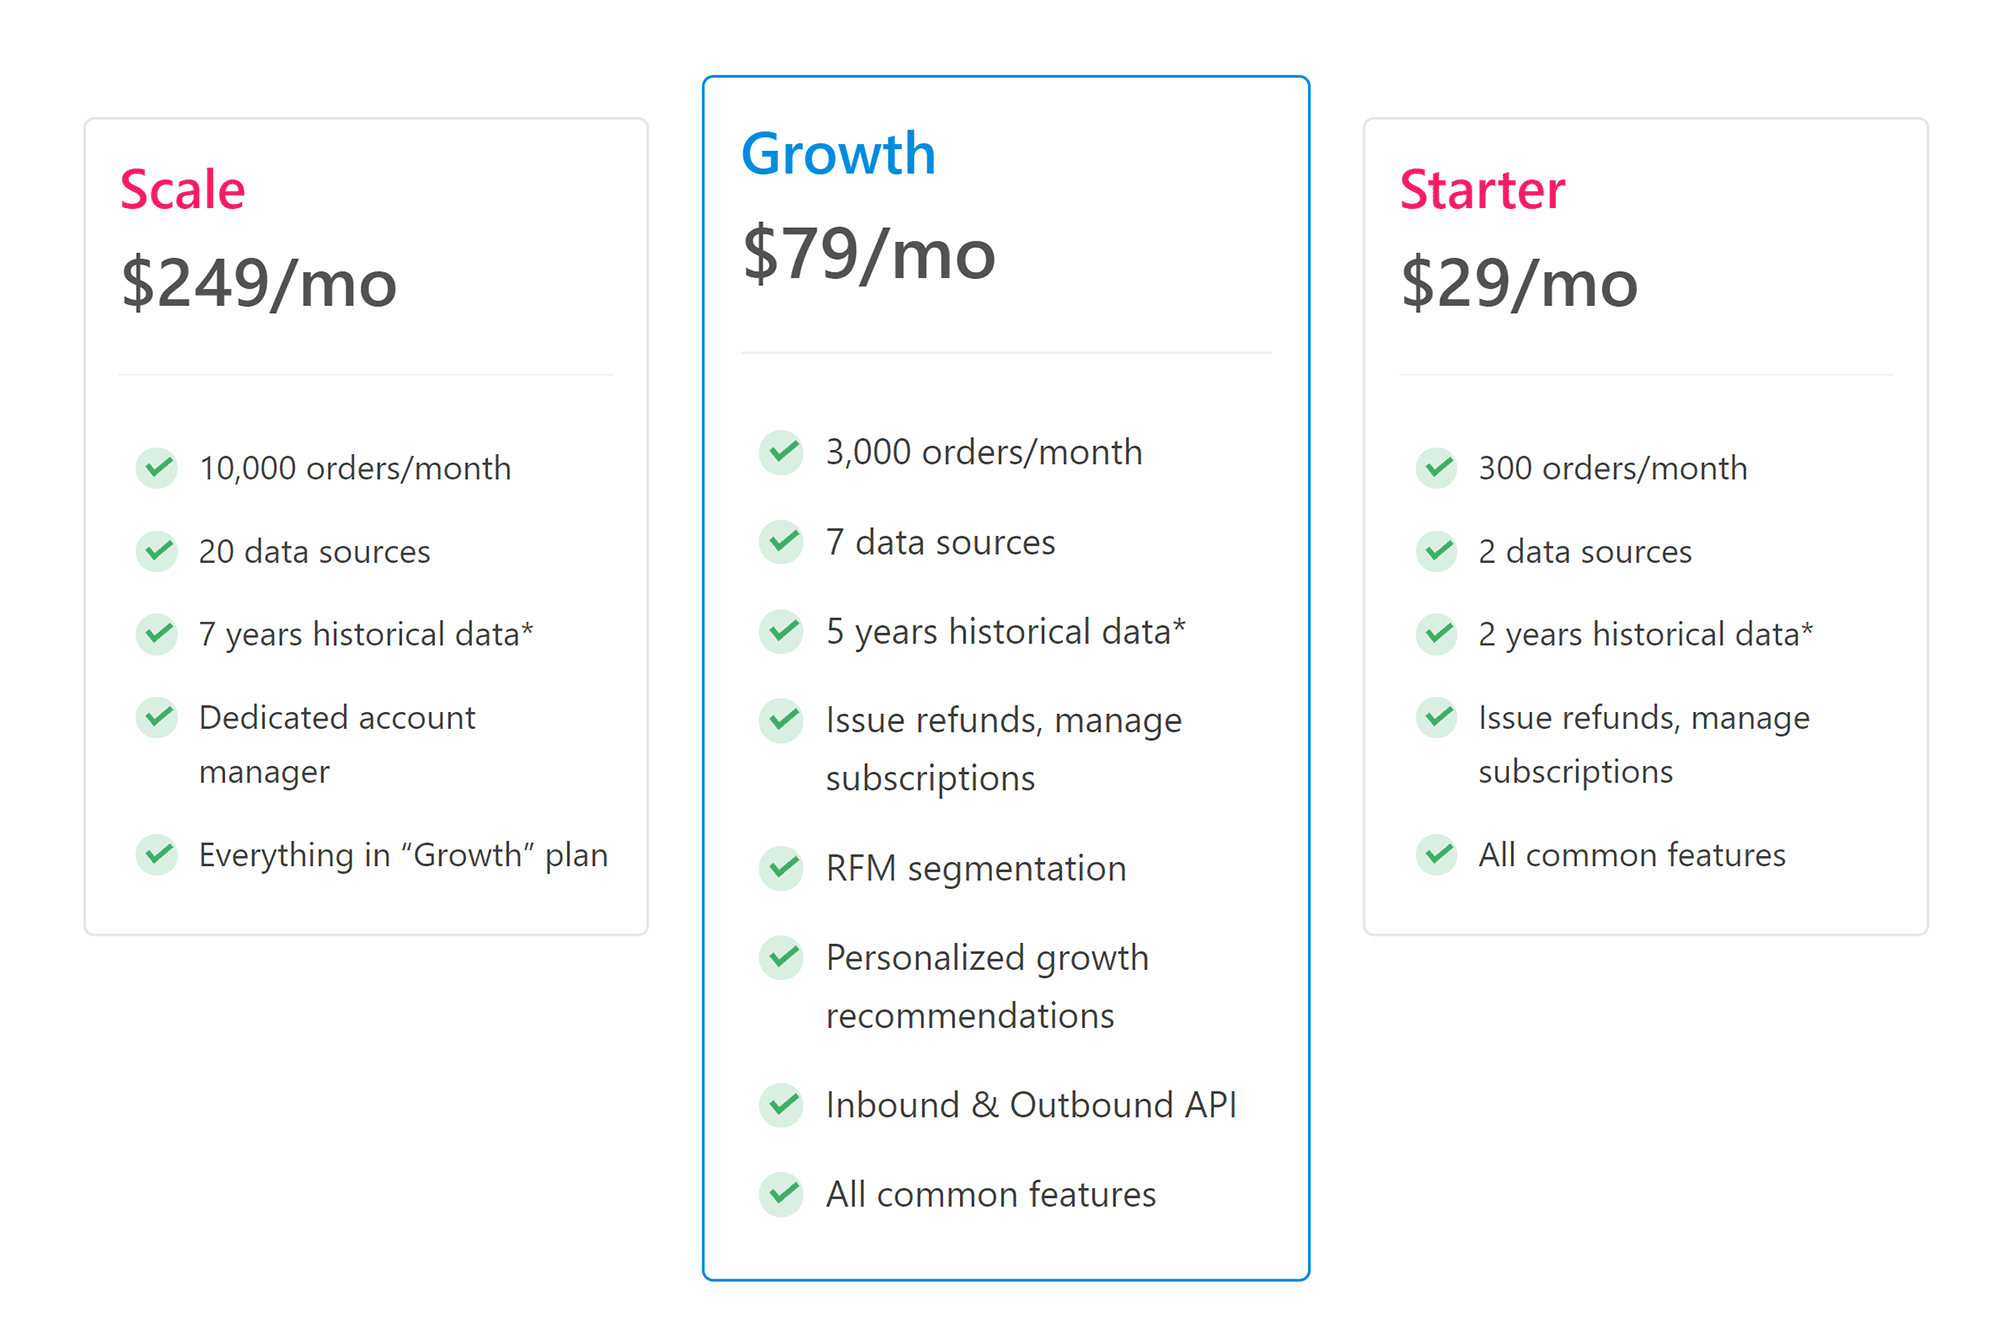
The most expensive plan is called scale. You will get a dedicated account manager if you sign up to this plan.
Retailing at $249 per month, this plan supports up to 10,000 orders per month and lets you connect up to 20 platforms to your account. Seven years of historical data can be accessed under this plan too.
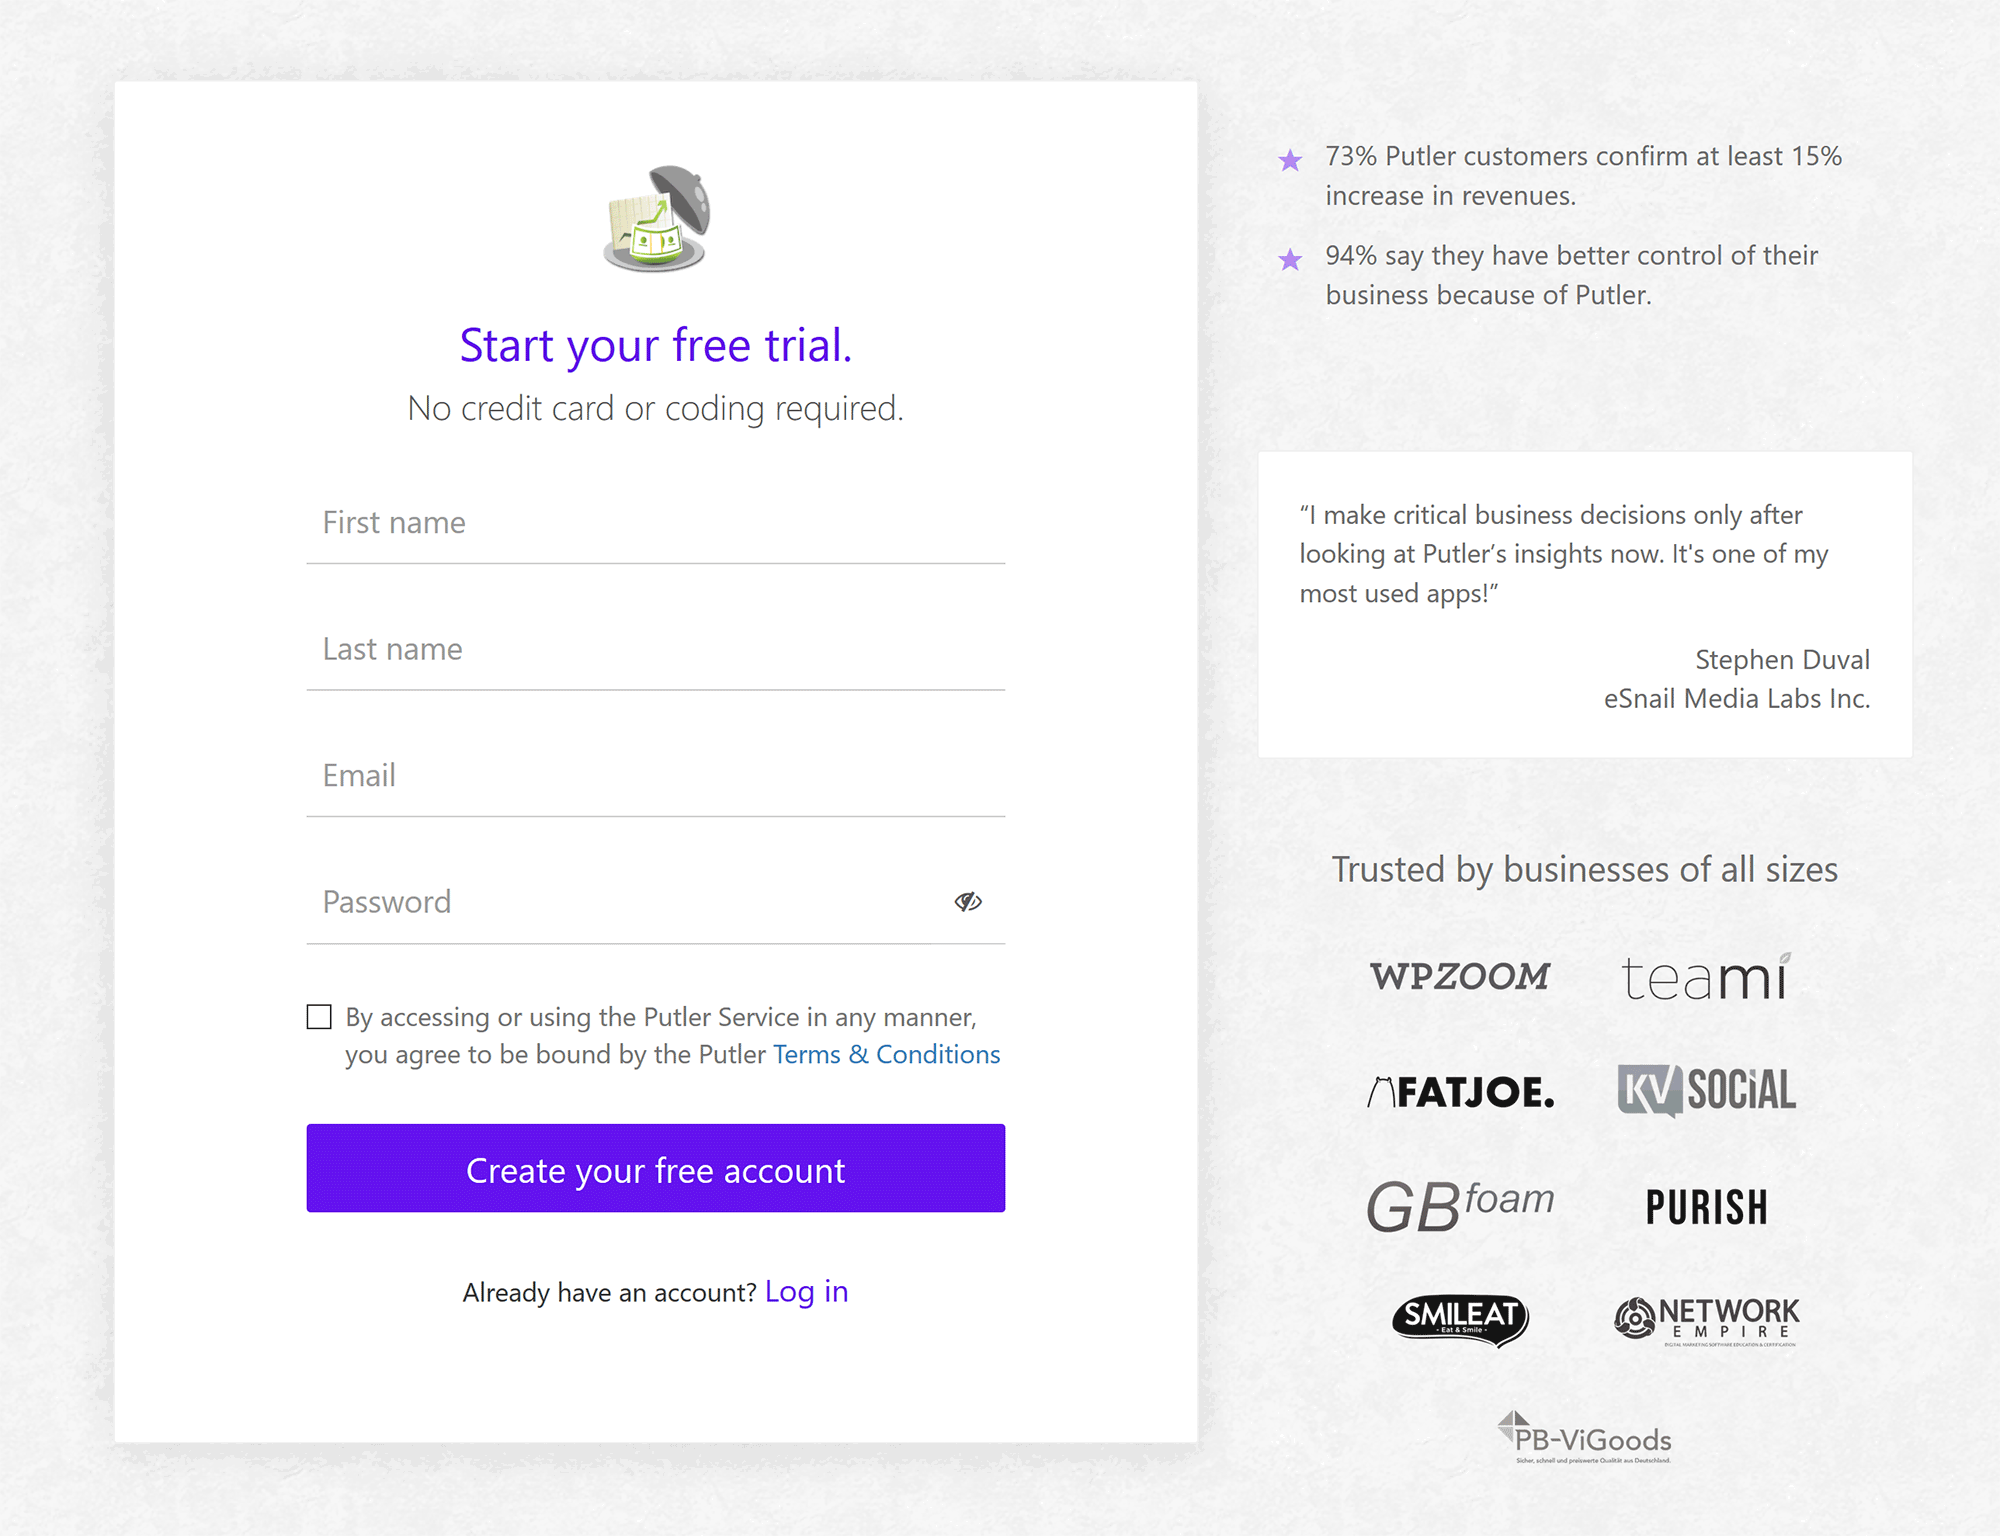
A 14-day free trial of Putler is available to everyone and no credit card details are required for signing up.
Under the free trial you can connect an unlimited number of platforms to your account and there is no restrictions on the number of transactions or orders that are processed. Three months of data are available in the free plan.
Putler also offers a 50% discount to non-profit organisations and educational institutes.
Between 22 November and 3 December 2019, Putler are offering a 20% discount on all of their plans. This reduces the cost of their starter plan to $23.20 per month, their growth plan to $63 per month and their scale plan to $199.20 per month.
It’s a fantastic offer so be sure to take advantage of it if you are looking to use Putler.
Final Thoughts
Over the last twenty years I have tested hundreds of statistical applications and analytics services. The main selling point of most of these alternative solutions is that they give you more information.
Putler have taken a different approach. Instead of showing you more stats, they pull data from existing services and strip everything down so that you are only showed what is relevant for growing your business.
I have no doubt that online shops and businesses will find Putler useful because of that.
I encourage you to check out the demo of Putler to see what the service offers.
Remember, you do not have to sign up immediately. Take advantage of their 14-day free trial and test the service with your business before you select a plan.
Good luck.
Kevin